The first test results
If your first test has completed now, let's find out how to read the report. If you haven't already started a test, make sure you do that first
Reading the report
🎉 Woo-hoo - exciting times! Congrats on running your very first test. Let's dive in... 🤿
Hopefully your tests completed without any errors. On the test list you'll now see your test results including the date/time, the number of tests run, and an error link to expand the results. Now click this arrow.
You'll see something like this (don't worry if your scores aren't yet this high - we spent a lot of effort reaching them 🥳)
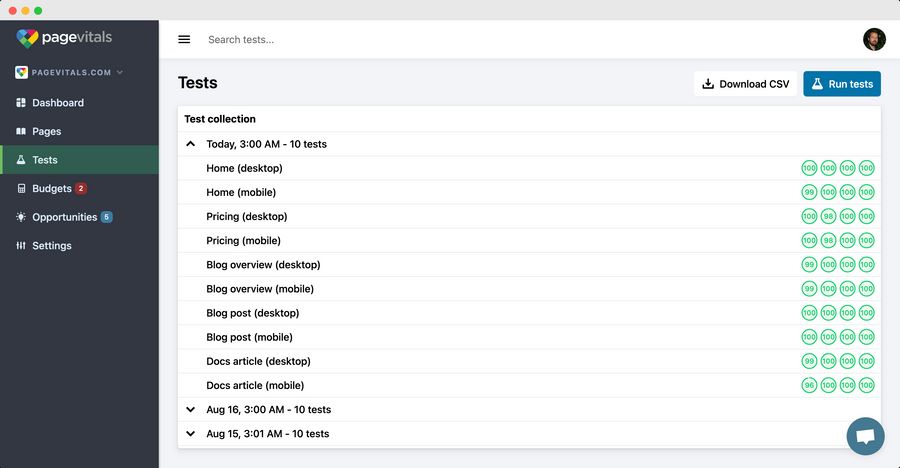
Each line represents a single test, consisting of a page (e.g. Home) and a device (e.g. Desktop). Click a line to see the full test report.
Report overview
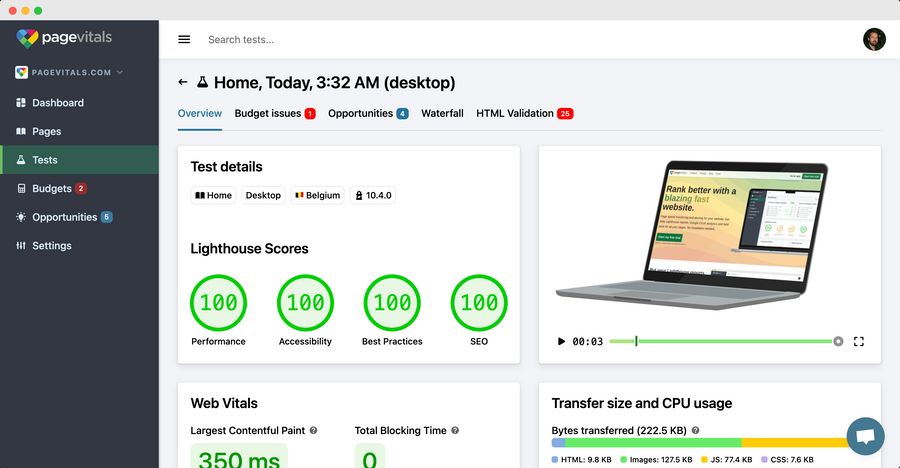
The first screen you'll see when clicking on a single test, is the report overview. You'll immediately see the Lighthouse scores, a screen recording of how your page loaded, a list of metrics on your page's performance, and an overview of how much network traffic is used (split across file types), as well as how much CPU was used (split across different CPU tasks) by the synthetic browser.
Budget issues
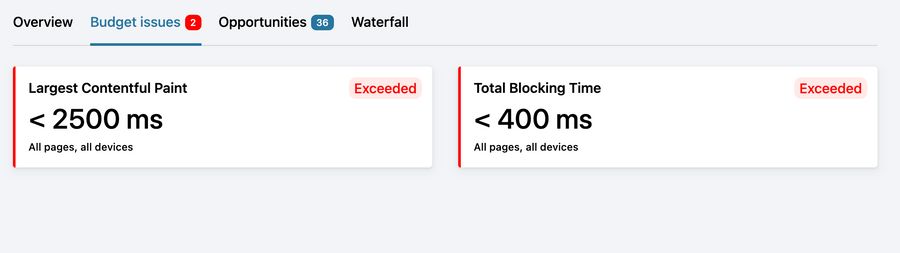
The Budget issues tab shows you if one or more of your budgets have been exceeded by the test results, or is at risk (meaning within 10% of exceeding).
Opportunities
Apart from the well-known gauges showing a score between 0 and 100, Lighthouse is really a collection of audits where each audit may give a recommendation (or opportunity) within one of four categories:
- Performance
- Accessibility
- Best Practices
- SEO
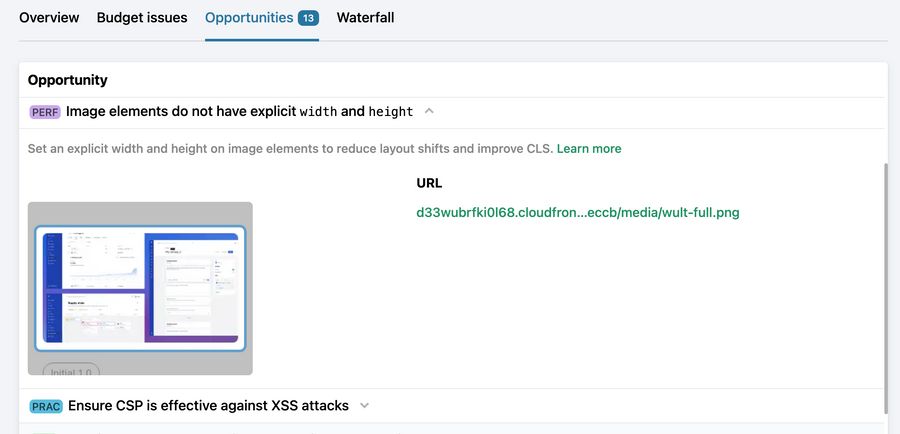
If you click the Opportunities tab, you'll see an overview of which opportunities were discovered by Lighthouse during the test.
The list may seem daunting at first, but we believe it's important that you familiarize yourself with the different opportunities.
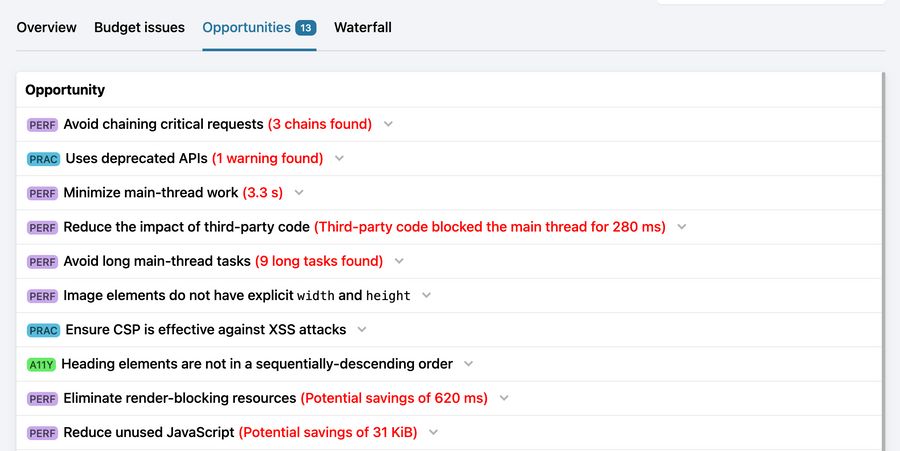
Each opportunity can be expanded to reveal the details.
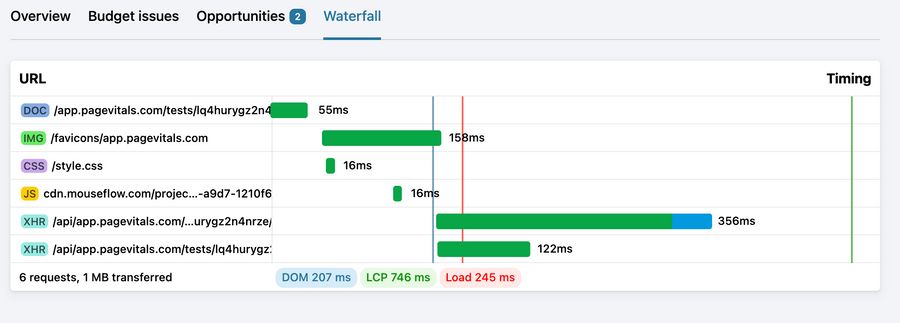
Network traffic waterfall
Finally, you can click the Waterfall tab to see a waterfall list of all the network resources required to render your page. You may know this type of report from Chrome Devtools or other tools. The idea is simple: you get to see each resource, some details about it, when it was loaded, and how long it took. It's a brilliant report to discover why your page is behaving the was it is.
That was a high-level overview on a test report. You can dive into more feature details under Features