Table of contents
Interaction to next paint (INP)
A slow page load is annoying once. A slow click is annoying every time. If "Add to cart," "Apply filters," or "Continue to checkout" feels laggy, users don't wait politely – they tap again, abandon, or lose trust that your site is working.
Interaction to Next Paint (INP) measures how quickly your page responds visually after a user interacts. In plain terms: from the moment someone clicks/taps/presses a key, how long until the page shows the next visible update that reflects that interaction.
What INP reveals about your UX
INP is a responsiveness metric. It answers: When a user tries to do something, how long does the site feel "stuck"?
This matters most on pages where interactions are the product experience:
- Category/listing pages (filters, sorting, quick view)
- Product pages (variant selection, image gallery, add to cart)
- Checkout (shipping methods, payment steps, promo codes)
- Logged-in experiences (dashboards, search, navigation menus)
The Website Owner's perspective
If INP is high, your site can look fast (good LCP) but feel broken during the actions that make money. That shows up as rage clicks, form drop-offs, fewer completed checkouts, and higher support tickets like "button doesn't work."
INP is also part of the Core Web Vitals, alongside LCP and CLS. Think of it as the Core Web Vital that covers "the site reacts when I touch it."
How INP is measured in practice
INP is built from real interactions during a page visit. For each interaction (like a click or tap), the browser measures the time until the next paint that reflects the result.
What counts as an interaction
INP generally includes user actions like:
- Clicks/taps
- Keyboard input (typing, enter, escape)
- Other discrete interactions
It does not treat scrolling as the kind of interaction INP is trying to capture (scroll performance is important, but measured differently).
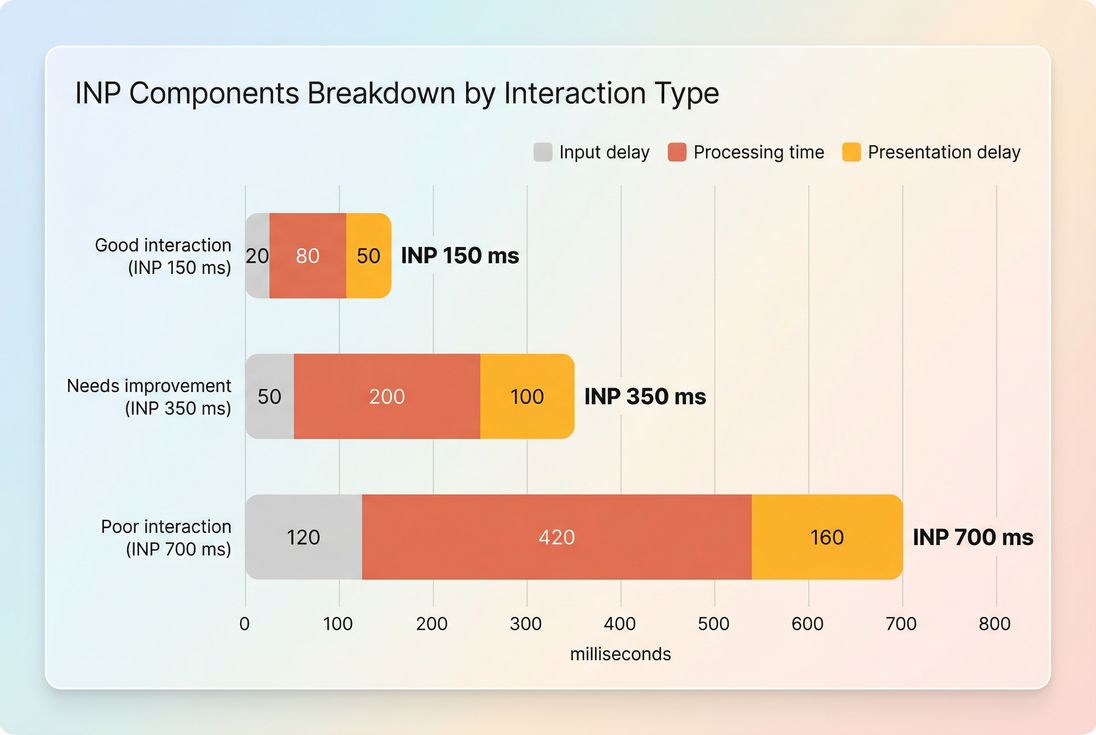
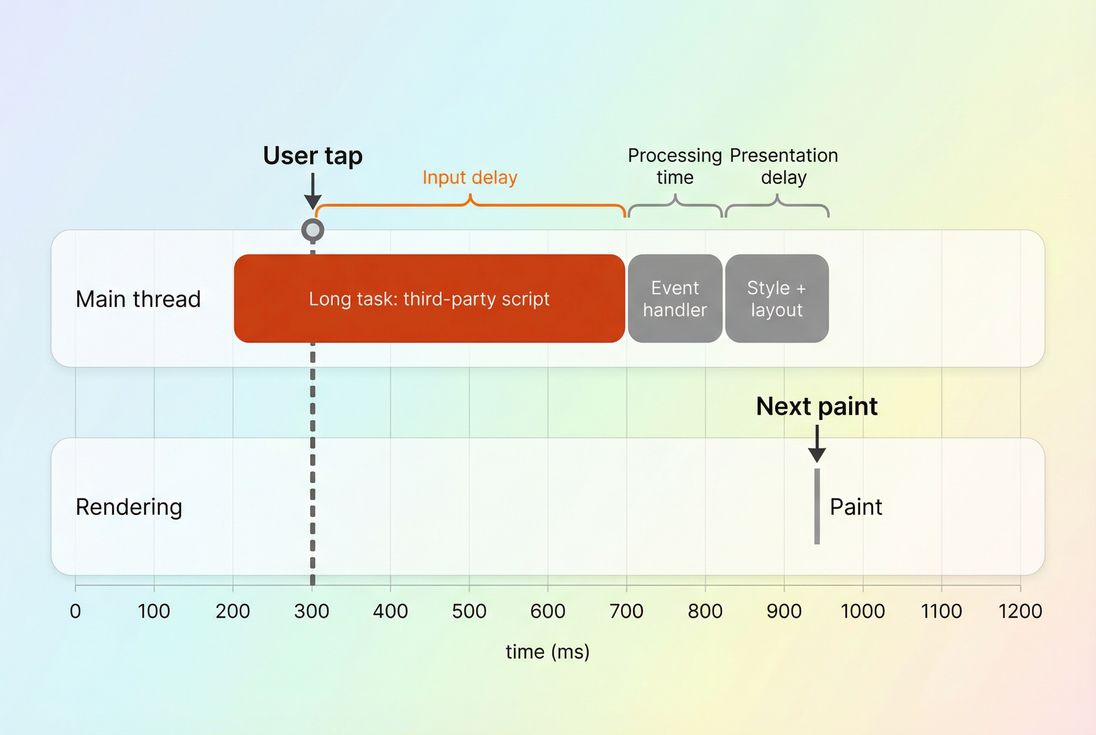
The three parts that drive INP
When an interaction is slow, it's usually because one (or more) of these is big:
- Input delay: the interaction waits because the main thread is busy.
- Processing time: your event handlers run too long (often JavaScript).
- Presentation delay: the browser can't paint quickly (style/layout/rendering work, or the next frame is missed).
This maps closely to common bottlenecks like long tasks and excessive JavaScript execution time.
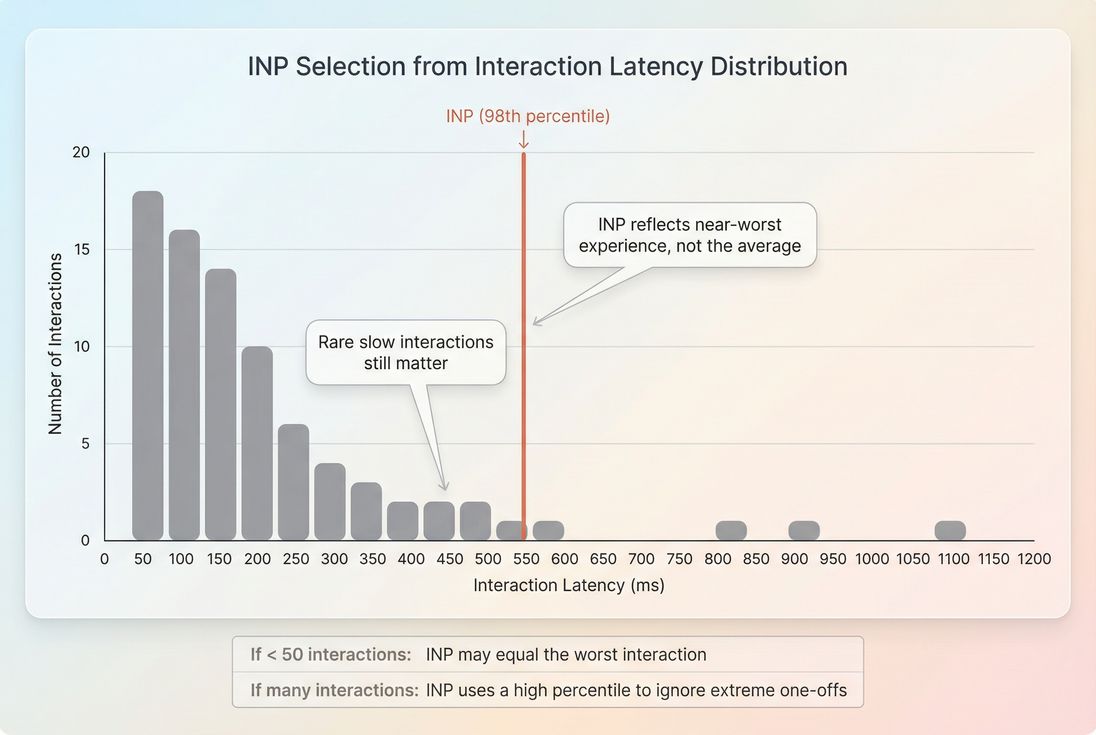
Which interaction becomes "the" INP
A single page view can have many interactions. INP is designed to reflect the near-worst interaction a user experienced on that page – so you don't "average away" a frustrating moment.
Practically:
- If there are many interactions, INP reflects a high percentile (near the worst).
- If there are only a few interactions, one slow action can dominate.
That design is intentional: one laggy "Place order" click matters more than ten fast "open menu" clicks.
Field INP vs what you see in lab tools
To make decisions, separate field and lab data:
- Field INP: what real users experience across devices and sessions. This is the number that matters for Core Web Vitals and business outcomes. See Field vs lab data and Measuring Web Vitals.
- Lab tools (like Lighthouse) are great for debugging, but they don't perfectly replicate real user interaction patterns. Lab often uses related signals like Total Blocking Time because it's easier to reproduce.
If you want to understand population-level responsiveness, use field sources like CrUX data. If you want to fix a problem, use lab traces to find exactly what's blocking the main thread.
What "good" INP looks like
Google's thresholds are widely used:
| INP (p75) | Meaning | What users feel |
|---|---|---|
| ≤ 200 ms | Good | UI reacts quickly, low friction |
| 200–500 ms | Needs improvement | Occasional lag, more repeat taps |
| > 500 ms | Poor | UI feels stuck; trust drops |
A key detail: for Core Web Vitals, the standard reported value is typically the 75th percentile (p75) of user page views. That means you're optimizing for "most users," not your best-case demo device.
The Website Owner's perspective
Treat p75 as your operational "quality bar." If p75 is good, most customers feel your UI is reliable. If only your median is good, you still have a big chunk of users – often mobile – who experience a laggy site and convert worse.
How to interpret INP changes
INP is easy to misread because it's driven by behavior (what users do) and capacity (how much work your page does).
Here's how to interpret common movements:
INP gets worse after a release
Most often, you shipped one of these:
- More JavaScript on the page (larger bundles, more hydration work, more runtime logic)
- A new third-party script (chat, A/B testing, personalization, reviews)
- A UI feature that triggers expensive layout/re-render on interaction
Start by checking for increases in:
- JavaScript bundle size
- Unused JavaScript
- Third-party scripts
- Long main-thread blocks (reduce main thread work)
INP improves but conversions don't move
That can happen if:
- You improved interactions that aren't on the purchase path
- You improved desktop but your revenue is mobile-heavy (or vice versa)
- You reduced interaction latency but the action still "feels slow" because the user is waiting on network/server work without immediate UI feedback
INP ends at the next paint. If you show instant feedback ("Added…", spinner, disabled button) you can improve perceived responsiveness even while the network request continues.
INP varies a lot by page type
That's normal. INP is not "site-wide JavaScript quality," it's "how responsive is this page's interactive experience."
- Product listing pages often regress due to filter UI and heavy DOM updates.
- Checkout often regresses due to validation scripts and third-party payment widgets.
- CMS pages often regress due to tag bloat.
This is why it's useful to break down by templates and flows, not just a homepage.
Why INP gets high (and where to look)
INP is a main-thread story most of the time. The browser can't process input and paint if the main thread is busy.
1) Input delay: the click is waiting
Symptoms:
- Click happens, nothing reacts immediately
- Feels like the UI ignored the tap
Common causes:
- Long JavaScript tasks running (long tasks)
- Too much work during/after navigation (heavy hydration, huge frameworks)
- Third-party scripts executing at unlucky times
What to do:
- Defer non-critical JS (async vs defer)
- Split bundles so interactions don't compete with page boot (code splitting)
- Remove dead code (unused JavaScript)
2) Processing time: your handlers do too much
Symptoms:
- UI reacts late specifically on certain actions (filter change, opening drawer, applying coupon)
- Often reproducible: "this button is always slow"
Common causes:
- Expensive synchronous work in event handlers
- Re-rendering large component trees on small state changes
- Doing heavy computations on the main thread instead of a worker
What to do:
- Make handlers lightweight; move non-urgent work off the critical path
- Break up long work so the browser can paint between chunks
- Reduce the amount of DOM/components updated per interaction
3) Presentation delay: the browser can't paint fast
Symptoms:
- The handler finishes, but the visual update still arrives late
- Often tied to layout-heavy pages (big tables, complex product grids)
Common causes:
- Forcing synchronous layout (layout thrashing)
- Large DOM + expensive style recalculations
- Heavy painting work (large shadows, complex effects, too many layers)
What to do:
- Reduce layout instability patterns (also helps CLS)
- Simplify above-the-fold complexity (above-the-fold optimization)
- Audit CSS and remove unused rules (unused CSS)
How website owners should use INP
INP is most useful when you use it to answer operational questions, not just "is my score green?"
Use INP to protect revenue flows
Map key steps (PDP → add to cart → cart → checkout) and look for where responsiveness breaks. If filters and variant selection are slow, you can lose shoppers before they ever reach checkout.
This is also where multistep flows help you separate "page loads fast" from "the flow feels fast." (For product-specific tooling, see documentation on multistep testing if you use it; conceptually, the goal is the same: measure the whole journey, not just the first page.)
Use INP to govern third-party script growth
Third-party scripts are a frequent INP killer because they can introduce unpredictable long tasks on the main thread.
If marketing adds a personalization tag, you want a clear policy:
- What pages can it run on?
- Can it be delayed until after user input is responsive?
- Can it be limited to a subset of traffic?
This connects directly to performance budgets as a decision tool, not a dev nicety.
Use INP to choose the right fixes
INP improvements tend to come from removing work, deferring work, or breaking up work. That's different from LCP fixes, which often focus on TTFB, images, and the critical rendering path.
The fastest ways to improve INP
If you need the most common, highest-ROI playbook, start here.
1) Kill long tasks on interactive pages
Long tasks block input and delay paint. They are one of the most direct drivers of poor INP.
Practical moves:
- Remove unused code: unused JavaScript
- Split bundles so the interactive UI is not competing with everything else: code splitting
- Reduce framework overhead on pages that don't need it (especially marketing pages)
- Delay non-essential work until after the page is stable
2) Control third-party JavaScript
Third parties often execute at the worst time: right when the user tries to click.
Practical moves:
- Remove or replace the worst offenders: third-party scripts
- Load third parties with sane timing (async vs defer)
- Audit tag manager changes like you audit code changes
3) Make interactions "paint something" quickly
Remember: INP stops at the next paint. If your interaction triggers a network request and you don't update UI until it returns, your INP can be terrible even if your code is "efficient."
Practical moves:
- Show immediate state: pressed state, loading indicator, disabled button, optimistic UI
- Render a lightweight placeholder immediately, then refine after data returns
- Avoid doing non-visual bookkeeping before the first UI update
4) Reduce render cost on state changes
If clicking a filter causes a giant DOM rewrite, you'll pay in presentation delay.
Practical moves:
- Avoid full re-renders for small UI changes
- Keep DOM size in check (especially product grids)
- Avoid patterns that force layout repeatedly
5) Keep the page boot lightweight
A page that's still "warming up" when users start interacting is a classic INP problem. Heavy boot work increases input delay.
Practical moves:
- Reduce main-thread work: reduce main thread work
- Minify assets to cut parse overhead: asset minification
- Compress transfers to reduce time-to-execute on mobile: Brotli compression or Gzip compression
A practical INP troubleshooting workflow
When INP is "bad," the hardest part is turning that into a concrete fix list. Here's a workflow that works for most sites.
Step 1: Confirm with field data
Start with real-user performance to avoid chasing lab-only issues. Use guidance from Field vs lab data and, where applicable, a field source like CrUX data.
If you use PageVitals field testing, the relevant docs are:
- Metric definition: /docs/metrics/interaction-to-next-paint/
- Reporting view: /docs/features/field-testing/web-vitals/inp-report/
Step 2: Segment by device and template
INP problems often hide in:
- Mobile only (CPU constrained)
- Logged-in only (more JS)
- Specific templates (PLP grid, checkout step)
Don't accept a single site-wide number as your only view.
Step 3: Reproduce the slow interaction in a lab run
Use a lab tool to capture a trace and identify:
- Long tasks around the interaction (long tasks)
- Heavy JS execution (JavaScript execution time)
- Third-party main-thread blocks (third-party scripts)
Lab is where you find the cause. Field is where you confirm the impact.
Step 4: Fix in descending certainty
Prioritize fixes with the highest certainty of improving INP:
- Remove or delay third-party scripts on critical pages
- Reduce long tasks (split work, code split, remove unused JS)
- Make the interaction paint quickly (immediate UI feedback)
- Reduce layout/render cost on interaction updates
Step 5: Prevent reintroductions
INP regressions are common because interactive work grows over time. Add guardrails:
- Enforce performance budgets for JS and third-party tags
- Review tag changes like releases
- Track long tasks and main-thread work continuously
The Website Owner's perspective
INP is a great "change detector." If it spikes after a marketing pixel change or a new feature release, you have a clear signal that the user experience of doing things got worse – even if page load metrics stayed stable.
How INP relates to other metrics
INP doesn't replace everything; it complements them:
- INP vs LCP: LCP is "how fast does content appear." INP is "how fast does it respond after." You often need both for conversion flows.
- INP vs TBT: Total Blocking Time is lab-only and correlates with responsiveness because it measures how much the main thread is blocked. INP is the real-user outcome.
- INP vs Page load time: page load time can be "done," yet your UI can still be sluggish due to heavy JS and rendering work.
Bottom line
INP is the metric that tells you whether your site feels reliable when customers try to act. If you're serious about conversions, treat INP as a first-class KPI on your highest-value flows.
If INP is high, don't start with cosmetic tweaks. Start where INP is born: long main-thread tasks, heavy JavaScript, expensive re-renders, and uncontrolled third-party scripts – then validate improvements with field data.
Frequently asked questions
Aim for INP at or below 200 ms at the 75th percentile to be considered good. If you are between 200 and 500 ms, prioritize fixes on high revenue flows like add to cart, filters, and checkout. Above 500 ms usually means users feel lag and misclicks increase.
Lighthouse is a lab test with a fixed device and network profile, and it does not measure field INP directly the same way real browsing does. Field INP reflects your actual device mix, third party tags, user behavior, and long sessions. Use field data to judge impact, lab tests to debug causes.
The most common causes are new or expanded JavaScript, a tag manager change, a chat or A/B testing script, heavier client side rendering, or new UI work that triggers expensive layout and rendering. Regressions often show up first on mobile, where CPUs are slower and long tasks are more frequent.
INP is a Core Web Vitals metric, so improving it supports search performance where page experience is a factor, but the bigger win is business impact. Faster interactions reduce rage clicks, form abandonment, and checkout friction. Treat INP as a conversion reliability metric, not just a score.
INP reflects the near worst interaction during a page visit, so one problematic action can dominate the score. Use a RUM view that can attribute slow interactions to specific elements and pages, then reproduce in a lab run with devtools performance traces to identify long tasks, heavy handlers, or rendering bottlenecks.
Want to take PageVitals for a spin?
Page speed monitoring and alerting for your website. Get daily Lighthouse reports for all your pages. No installation needed.
Start my free trial