Table of contents
Reducing JavaScript bundle size
JavaScript bloat quietly taxes revenue: slower pages lose impatient shoppers, and heavy scripts make the site feel "laggy" even after it looks loaded – hurting conversion, SEO visibility, and paid campaign efficiency.
Reducing JavaScript bundle size means cutting down the total bytes of JavaScript a browser must download (and typically parse/compile) to render and use a page – especially the code required for the first view. Smaller bundles usually load faster, block the main thread less, and improve responsiveness signals like INP and lab proxies like Total Blocking Time.
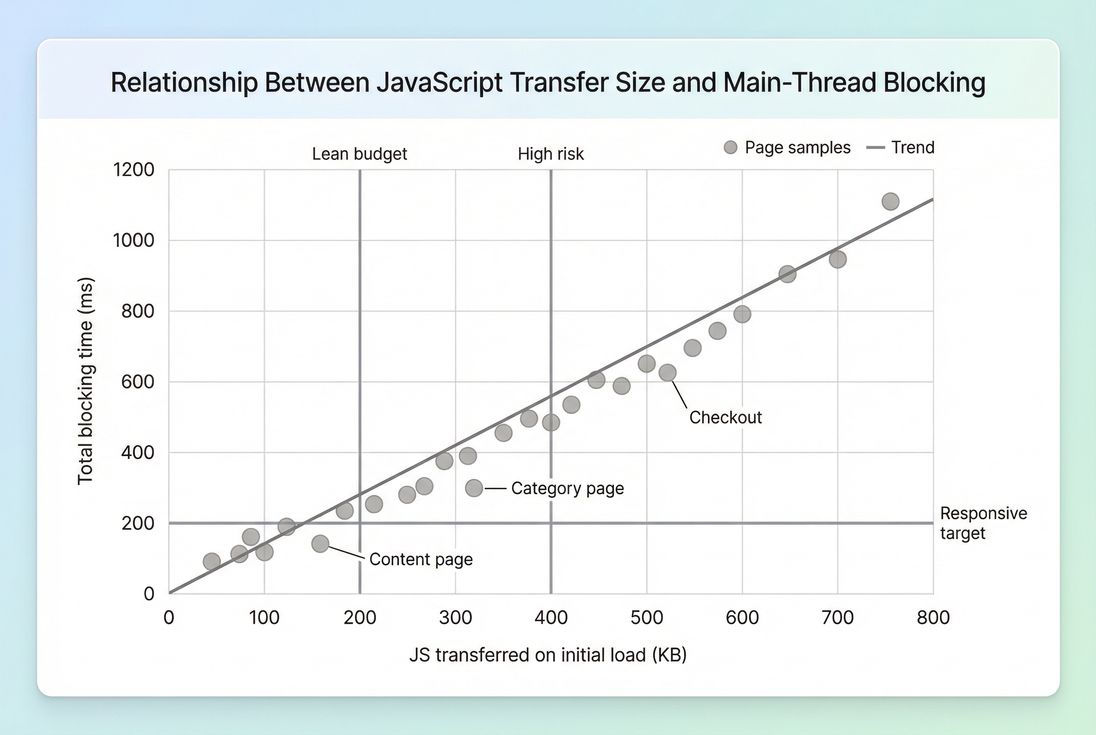
*As JavaScript bytes climb, main-thread blocking usually rises too – especially on mobile CPUs – making INP and "site feels slow" complaints more likely.*
What bundle size actually measures
"Bundle size" gets used loosely. For decision-making, separate three related measurements:
Resource size (uncompressed)
The file size of your.jsassets as stored and built (what you'd see on disk).Transfer size (compressed over the network)
What the user actually downloads after Brotli compression or Gzip compression. This is what impacts network time.JavaScript cost on the main thread
Even a "small" transfer can be expensive if it triggers heavy parsing, compilation, or execution. This shows up as long tasks and delays to interactivity (see JS execution time and Main thread work).
When people say "reduce bundle size," they often mean "reduce the amount of JS shipped to the browser for the initial experience." That's the right framing for most business outcomes.
The Website Owner's perspective
If customers complain that the site "loads but doesn't respond," you're usually paying a JavaScript tax. Reducing JS on the first view often improves responsiveness without changing design – meaning fewer abandoned sessions, better mobile conversion, and less wasted spend on ads that land on sluggish pages.
How it is calculated in practice
Most tools report JavaScript size by summing JavaScript resources loaded during a page load. The key nuance is which resources and when they load.
Common rollups you'll see:
- JS on initial load: scripts downloaded as part of the initial navigation before the page becomes usable.
- Total JS during the full page load: includes scripts fetched later (after load event, late third-party calls, route prefetches).
- First-party vs third-party JS: important because third-party is often the hardest to control (see Third-party scripts).
Also, tools may report transferred bytes and uncompressed bytes. You should track both:
- Transferred JS tells you about network cost (especially important on slower connections; see Network latency).
- Uncompressed JS correlates more with parse/compile cost and memory pressure.
If you're using PageVitals reporting, the most actionable place to connect size with real delays is a network waterfall view (see /docs/features/network-request-waterfall/), where you can identify which scripts are largest, when they start, and whether they block rendering.
Why "smaller" doesn't always mean "faster"
A 200 KB reduction can be a big win – or barely noticeable – depending on what you removed:
- Removing unused code typically helps both transfer and main-thread time (see Unused JavaScript).
- Removing a library used on every interaction can reduce long tasks and improve INP.
- Compressing the same code reduces transfer size but doesn't reduce execution cost.
So interpret bundle changes in the context of what the code was doing.
How big is too big
There's no universal number, but website owners need workable budgets. Here's a practical starting point for initial view transferred JS on mobile.
| Page type | Good starting budget | When it's risky |
|---|---|---|
| Content/landing page | ≤ 200 KB | ≥ 350 KB |
| Category/PLP | ≤ 250–300 KB | ≥ 450 KB |
| PDP (product detail) | ≤ 300–350 KB | ≥ 500 KB |
| Cart/checkout | ≤ 350–450 KB | ≥ 650 KB |
Why these ranges:
- On mobile, bigger JS often means more download time and more main-thread blocking.
- E-commerce pages also tend to carry personalization, analytics, reviews, and experimentation scripts – so you need stricter prioritization, not just "more budget."
If you're consistently above the "risky" column, you should expect elevated odds of:
- Poorer Core Web Vitals, especially INP
- More rage clicks and form frustration
- Higher abandonment on mid-tier Android devices
The Website Owner's perspective
A JavaScript budget is an operating constraint, like a freight cost ceiling. If every new marketing tag or UI feature pushes you over budget, you need a gatekeeping process – otherwise conversion drops become "mysterious" and nobody can ship confidently.
What usually inflates JavaScript size
Most bloated bundles come from a handful of repeat patterns.
Over-shipping for the first view
Single-page apps and heavily componentized sites often ship code for:
- routes the user hasn't visited
- widgets below the fold
- admin/debug tooling that slipped into production
This is why Above-the-fold optimization and "only ship what's needed now" is the most profitable mindset.
Dependency weight and duplication
Common causes:
- multiple libraries solving the same problem (date, analytics wrappers, sliders)
- importing entire utility libraries instead of individual functions
- duplicate versions of a dependency across micro-frontends
Locale and polyfill payloads
A classic example is shipping:
- all locales for date/time formatting
- broad polyfills that cover browsers your customers don't use
Third-party scripts that multiply
Third-party scripts often:
- load additional scripts ("script chains")
- run early and block the main thread
- evade your bundling controls entirely
If bundle size looks reasonable but responsiveness is still bad, third-party execution is a prime suspect.
Which reductions actually move the needle
If you're busy, don't start by arguing about "minify vs compress." Start by removing bytes you don't need to ship.
1) Remove unused JavaScript first
This is the highest ROI category: it reduces transfer, parsing, and execution.
What to do:
- Use coverage reports in DevTools to find code that isn't executed on initial view.
- Audit framework-level features that pull in big chunks (editors, charting, WYSIWYG, maps).
- Remove dead routes, old experiments, and legacy utilities.
Related concepts: Unused JavaScript, Asset minification.
2) Split by route and by feature
Code splitting is the standard playbook for keeping the initial bundle lean.
Good splitting boundaries:
- route-level (home vs PDP vs checkout)
- feature-level (reviews, recommendations, chat, loyalty)
- admin-only or logged-in-only
A practical rule: if a feature is not required to render and use the first view, it should not be in the initial chunk.
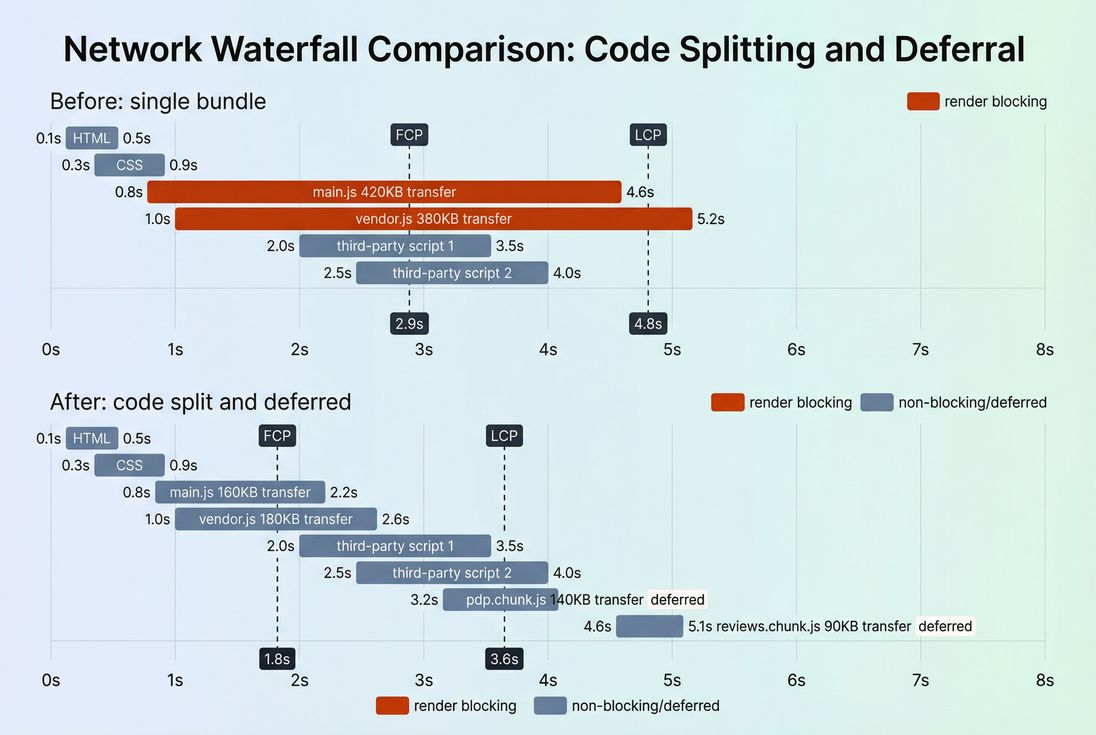
*Code splitting reduces how much JavaScript must load before users see and use the page – improving perceived speed and lowering main-thread contention.*
3) Make third-party scripts earn their keep
This is where business discipline matters most.
Actions that work:
- Remove redundant tags (multiple analytics collectors, old pixels).
- Delay non-essential tags until after first render or after consent.
- Avoid loading "all pages" scripts on checkout unless they directly impact revenue.
Even if third-party code isn't inside your "bundle," it still counts against the user's total JS cost and can degrade INP and Total Blocking Time.
Related: Third-party scripts, Render-blocking resources.
4) Load scripts without blocking rendering
Two common improvements:
- Use
deferfor scripts that don't need to run before HTML parsing completes. - Use
asynccautiously (great for independent scripts; can be unpredictable if scripts depend on order).
See: Async vs defer.
This doesn't reduce bytes, but it changes when the browser pays the cost – often improving early paint and reducing user-visible jank.
5) Minify, then compress, then cache correctly
These are table-stakes "hygiene" items:
- Minify JavaScript (Asset minification)
- Compress with Brotli (Brotli compression) or gzip
- Ensure long-lived caching for hashed assets (Browser caching, Cache-Control headers, Cache TTL)
Important nuance:
- Compression primarily helps first-time visitors and cache misses.
- Caching helps repeat visitors – but only if you fingerprint assets and avoid frequent invalidation.
6) Shrink what you ship from libraries
High impact tactics:
- Replace heavy libraries with lighter alternatives (or native APIs).
- Avoid "import the world" patterns (especially utility and date libraries).
- Strip unused locales and optional features at build time.
This is often where teams unlock the next 100–300 KB after code splitting is already in place.
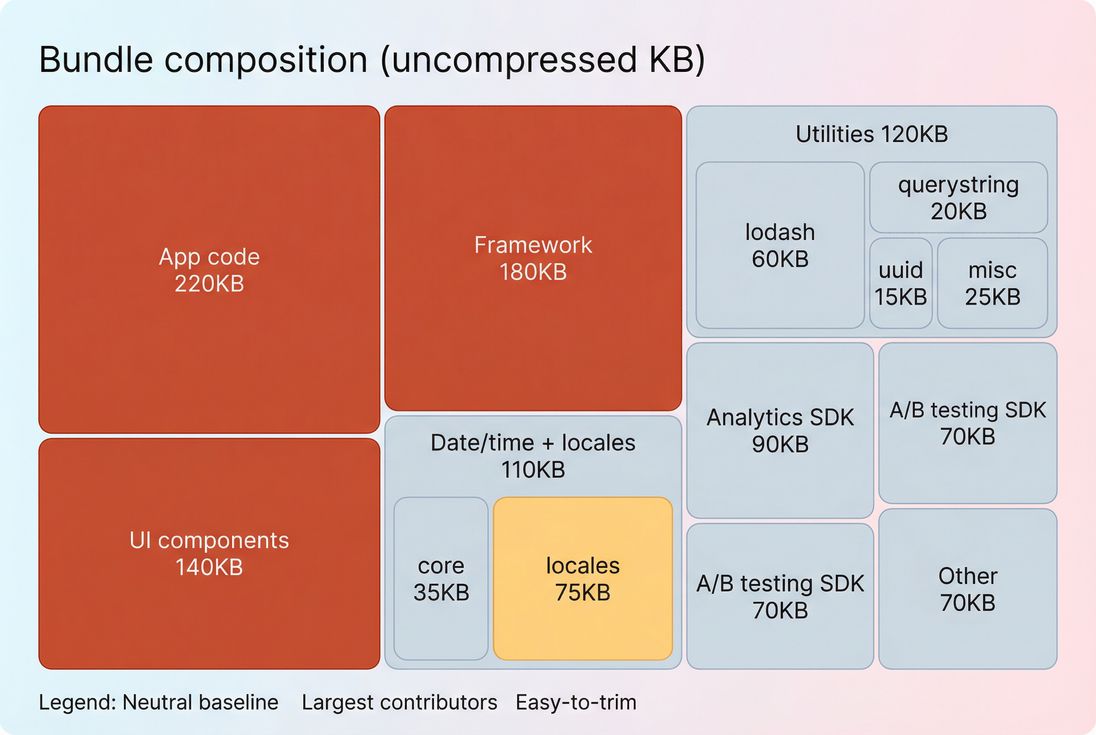
*A bundle composition view makes it obvious where to focus: big framework/vendor blocks, bloated utilities, and "accidental" payloads like locales are common quick wins.*
How to interpret bundle size changes
Bundle size changes are only "good" if they reduce user friction or risk. Here's how to read the signal.
When a decrease is meaningful
A reduction is usually real progress when it results in one or more of the following:
- earlier FCP or LCP
- fewer or shorter long tasks (lower Total Blocking Time)
- better INP in field data
- improved conversion on mobile segments
When a decrease can be misleading
Watch for these tradeoffs:
- Split too aggressively: you reduce initial JS, but create many follow-up requests that delay interactions later (especially if cache is cold).
- Shift work later: deferring scripts can improve first paint while still causing jank right when users scroll or tap.
- Hide the cost in third-party: first-party bundles shrink, but new tags erase the gain.
When size isn't the primary limiter
Sometimes the "bundle" isn't the problem. Examples:
- LCP is limited by server latency (TTFB) or slow image delivery (Image optimization).
- INP is dominated by expensive handlers, not bytes (see Long tasks and JS execution time).
- Heavy client-side rendering delays content even if bundles are moderate (see Critical rendering path).
A practical plan website owners can run
This is the fastest path from "we think JS is heavy" to a prioritized backlog.
Step 1: Measure the right thing
Track:
- transferred JS on initial view (mobile profile)
- biggest JS resources (top 5)
- third-party JS presence and timing
If you're using PageVitals, combine Lighthouse-based findings (see /docs/features/lighthouse-tests/) with request-level analysis in the waterfall (see /docs/features/network-request-waterfall/).
Also decide whether you're optimizing for lab stability or real users:
- Lab is great for catching regressions.
- Field data tells you whether customers actually improved (see Field vs lab data and CrUX data).
Step 2: Categorize the JS you're shipping
Create three buckets:
- Must-have for first view (keep, but optimize)
- Needed later (split/defer)
- Nice-to-have (remove or load on demand)
This framing prevents endless bikeshedding and forces business prioritization.
Step 3: Apply fixes in high-ROI order
A typical sequence that works:
- Remove unused JS and dead dependencies
- Implement route/feature code splitting
- Fix render-blocking script loading (Async vs defer)
- Minify and compress (Asset minification, Brotli compression)
- Fix caching for hashed assets (Cache-Control headers)
- Audit third-party scripts and delay/remove
Step 4: Prevent regressions with budgets
Bundle size tends to creep. The fix is governance:
- Set a JavaScript size budget for key templates (home, PLP, PDP, checkout).
- Fail builds or block releases when budgets are exceeded.
- Require an "owner" for every third-party script.
If you want to operationalize this, PageVitals supports performance budgets as a first-class feature (see /docs/features/budgets/) and can be integrated into CI workflows (see /docs/ci-cd/).
The Website Owner's perspective
A budget changes the internal conversation from "should we add this tag?" to "what are we willing to trade away for it?" That's how you protect conversion during growth – without slowing down marketing or product teams.
Quick troubleshooting patterns
Use these fast checks when you see bundle size spikes or sudden regressions.
After adding a new marketing tool
- Did it load on all pages, including checkout?
- Does it pull in additional SDKs?
- Can it be delayed until after the first interaction?
After a redesign
- Did you move more rendering to the client?
- Did you introduce a component library that ships heavy JS everywhere?
- Did you lose code splitting boundaries?
After a framework upgrade
- Did polyfills expand?
- Did tree shaking stop working due to build config changes?
- Did you accidentally ship both modern and legacy bundles to everyone?
Key takeaways
- Bundle size is not just "a number" – it's a proxy for download time plus main-thread cost, which directly affects responsiveness and conversion.
- Track both transferred and uncompressed JS, and always connect changes to outcomes like INP, LCP, and long tasks.
- The biggest wins usually come from removing unused JS, code splitting, and controlling third-party scripts, then tightening up minification, compression, and caching.
- Put a JavaScript performance budget in place so this doesn't become a recurring fire drill.
Frequently asked questions
For most e-commerce pages, aim to keep the JavaScript transferred on the initial view under 300 KB on mobile, and lower if possible. Product listing and content pages should often be below 200 KB. Treat this as a budget, then validate with field metrics like INP and LCP.
Often yes, but not always. Smaller bundles usually reduce download time, parsing, and main-thread blocking, which can improve INP and sometimes LCP. If your issues are image-heavy or server-latency driven, bundle reductions may have limited impact. Confirm what's actually delaying LCP and causing long tasks.
Compression helps network transfer size, but it does not reduce how much JavaScript the browser must parse, compile, and execute. That means compression alone may not fix interaction delays. The best results come from removing unused code, splitting routes, and reducing third-party scripts, then applying Brotli or gzip.
Third-party scripts often load additional JavaScript outside your main bundle, but they still consume bandwidth and main-thread time. Tag managers, chat widgets, A/B testing, and personalization are frequent offenders. Consider third-party JavaScript part of your total JS budget and audit it like you would first-party code.
Set a performance budget for JavaScript size and enforce it in CI. Track total transferred JS and the biggest scripts over time, and require justification for new libraries. Re-check code splitting, tree shaking, and dependency usage during feature work, not after. Monitor regressions with synthetic and field trends.
Want to take PageVitals for a spin?
Page speed monitoring and alerting for your website. Get daily Lighthouse reports for all your pages. No installation needed.
Start my free trial