Table of contents
JavaScript execution time optimization
JavaScript execution time is one of the fastest ways to accidentally "tax" every visitor – especially on mobile. When your site spends too long running JavaScript, the page might look loaded but still feels laggy: taps don't respond, add-to-cart stalls, filters freeze, and checkout inputs drop keystrokes. That hurts conversion, not just Lighthouse scores.
Definition (plain English): JavaScript execution time is the total time the browser's main thread spends running JavaScript for your page (parsing, compiling, evaluating, and related work like garbage collection) during load and early interaction. While the main thread is busy, it can't paint updates or respond quickly to user input.
This topic connects directly to responsiveness metrics like INP and diagnostic signals like long tasks and Total Blocking Time. It also overlaps with main thread work overall, because JavaScript is a common reason the main thread gets saturated.
[% image "./img/javascript-execution-time-1.png", "Stacked bars comparing main thread time before and after reducing JavaScript execution time", "Create a publication-ready stacked bar chart for a web performance article. Two horizontal stacked bars labeled 'Before' and 'After'. X-axis runs left-to-right from 0 to 6000 milliseconds with tick marks every 1000 ms. Each bar is divided into five segments with a legend: 'Loading', 'Scripting', 'Rendering', 'Painting', 'Idle'. The 'Before' bar totals 5600 ms with Scripting as the largest segment (2600 ms), Rendering 1100 ms, Loading 900 ms, Painting 400 ms, Idle 600 ms. The 'After' bar totals 4200 ms with Scripting reduced to 1200 ms, Rendering 1000 ms, Loading 900 ms, Painting 400 ms, Idle 700 ms. Use neutral colors for baseline categories, a clearly emphasized negative-impact color for Scripting, and a positive-improvement accent only as an annotation arrow showing 'Scripting -1400 ms'. Place a small callout above the Scripting segment in the 'Before' bar reading 'Long tasks more likely'. No icons, no illustrations, no people, no fake UI controls, no decorative shapes. Ensure text is crisp and legible at 1536 px width, with clear hierarchy: first notice the Scripting reduction, second notice total time reduction, third notice other segments remain similar.", "(max-width: 1024px) 100vw, 1096px", page.url %]
*When scripting dominates main-thread time, the page often feels interactive later – even if it visually loads. Reducing scripting typically improves responsiveness and can pull other work earlier.*
What this metric reveals
JavaScript execution time answers a practical question:
Is my page spending too much CPU time running code instead of responding to customers?
High execution time usually shows up as one (or more) of these business symptoms:
- Product pages that scroll jankily or lag when opening image galleries
- Collection pages where filters "hang" on mobile
- Checkout pages where typing feels delayed
- SPAs where route changes look fast but controls don't respond for a second
It's also a frequent root cause of:
- Worse INP (slower input responsiveness)
- Higher Total Blocking Time in lab tests
- Sometimes worse LCP if JavaScript delays rendering or content creation
The Website Owner's perspective
If customers complain that the site feels sluggish but your hosting and CDN look fine, JavaScript execution is often the missing explanation. It's the "hidden cost" of features: reviews widgets, personalization, A/B tests, chat, heatmaps, and heavy front-end frameworks.
How JavaScript execution time is measured
JavaScript execution time is typically derived from a browser performance trace (like what Lighthouse collects). Conceptually, it's:
- Time on the main thread attributed to JavaScript work, including:
- Parsing and compiling scripts
- Executing code (evaluation, function calls)
- Garbage collection and runtime overhead caused by JS
- Some frameworks' bootstrapping and hydration work (which is still JS time)
Important interpretation detail: execution time is CPU time, not network time. You can download a script quickly and still spend seconds executing it.
Why results differ across devices
Execution time is highly device-dependent:
- A page that executes in 700 ms on a developer laptop can take 2–4 seconds on a mid-tier phone.
- That's why lab tools often use mobile CPU throttling: it approximates slower devices.
Execution time vs long tasks
Execution time becomes a user problem when it creates long tasks – work chunks that block the main thread long enough to delay input and rendering.
- Long tasks are covered in detail here: Long tasks
- They are a primary contributor to lab Total Blocking Time
- They are closely related to poor field INP
If you use PageVitals, the Long tasks opportunity report is the quickest way to identify which tasks are blocking the main thread most often: /docs/opportunities/long-tasks/.
What "good" looks like in practice
JavaScript execution time is not a Core Web Vital by itself, so there's no single official threshold. But you still need working benchmarks to make decisions.
Here are practical ranges many sites can use for initial load scripting on mobile lab tests:
| JavaScript execution time (initial load) | Practical interpretation | What to do |
|---|---|---|
| < 800 ms | Usually healthy | Maintain; prevent regressions with budgets |
| 800–1500 ms | Watch zone | Audit third-party and above-the-fold JS |
| 1500–2500 ms | Likely hurting UX | Code split, remove unused JS, cut long tasks |
| > 2500 ms | High risk | Treat as conversion-impacting; prioritize fixes |
Two important caveats:
- Page type matters. A content article can be far lower than an interactive configurator.
- Distribution matters. A single 600 ms long task can feel worse than 1.2 seconds spread out in small chunks.
The Website Owner's perspective
Don't chase a number in isolation. Use execution time to decide whether your next sprint should focus on front-end cleanup versus server work like TTFB or caching. If the main thread is saturated, new marketing tags can be more damaging than a slower origin.
Where execution time usually comes from
Most high-JS-execution pages fall into a few repeatable patterns.
Too much code runs before the page is usable
Common causes:
- Loading the full app shell on every page
- Running personalization and experiments immediately
- Rendering complex UI components above the fold
Fix direction:
- Move non-critical work later (or only on interaction)
- Apply above-the-fold optimization principles to JS, not just images and CSS
Bundles include code users never use
This is especially common with:
- Component libraries where you import "everything"
- Legacy utilities that are no longer referenced
- Shipping multiple variants (desktop + mobile) together
Fix direction:
- Remove dead code and libraries: Unused JavaScript
- Split by route and component: Code splitting
- Keep bundle work clean: Asset minification
Framework hydration and rerenders are expensive
For React/Vue/Angular/Next-like stacks, the heavy part can be:
- Hydrating server-rendered markup
- Running initial effects/hooks
- Re-rendering because state initializes in multiple phases
- Generating large DOM trees early
Fix direction:
- Reduce above-the-fold component complexity
- Defer non-critical components
- Avoid cascading rerenders on load (measure with profiling)
Third-party scripts dominate CPU
Third-party scripts are frequent "execution time multipliers" because they:
- Run on every page
- Execute early to capture sessions
- Add event listeners and DOM mutation observers
- Inject iframes and run additional code
Start here: Third-party scripts
The Website Owner's perspective
Third-party scripts are business decisions, not just technical details. If a script adds 300 ms of long tasks but drives negligible revenue, it's effectively a conversion tax. Put owners on every tag and require measurement, not assumptions.
Fixes that reduce execution time
This section is intentionally action-first. The goal is to remove or delay JavaScript that does not need to run now.
1) Remove JavaScript you don't need
Highest ROI actions:
- Delete unused libraries (date libraries, legacy polyfills, animation libs)
- Replace heavy utilities with smaller equivalents
- Remove old vendor tags and duplicated tracking
Tactics:
- Use Unused JavaScript findings to target real waste
- Keep the pipeline clean with Asset minification and tree-shaking where possible
What you should see:
- Lower scripting time
- Fewer long tasks
- Often improved Speed Index because rendering can progress sooner
2) Split code by page and intent
If your product page ships the same JavaScript as your checkout, you're paying for features customers aren't using yet.
Apply:
- Route-based splitting (each template/page type loads only what it needs)
- Component-level lazy loading (load carousels, review widgets, editors on interaction)
Learn the concept: Code splitting
What you should see:
- A meaningful drop in execution time during initial load
- Similar total JS over the whole session, but shifted to when it's needed
3) Load scripts without blocking parsing
For third-party and non-critical first-party code:
- Prefer
deferfor scripts that can wait until HTML parsing completes - Use
asynccarefully for independent scripts that don't rely on DOM order
Guide: Async vs defer
This doesn't always reduce total execution time, but it can:
- Improve early rendering
- Reduce render-blocking behavior
- Move code to a less sensitive window
4) Break up long tasks
If you can't remove the work, you can often chunk it so the browser can respond between chunks.
Common examples:
- Large JSON parsing
- Building big DOM fragments
- Running expensive loops on load
Approaches:
- Schedule non-urgent tasks after the page is interactive
- Split work into smaller chunks so you avoid long tasks
- Use Web Workers for CPU-heavy computation that doesn't touch the DOM (when feasible)
This is one of the most reliable paths to better INP.
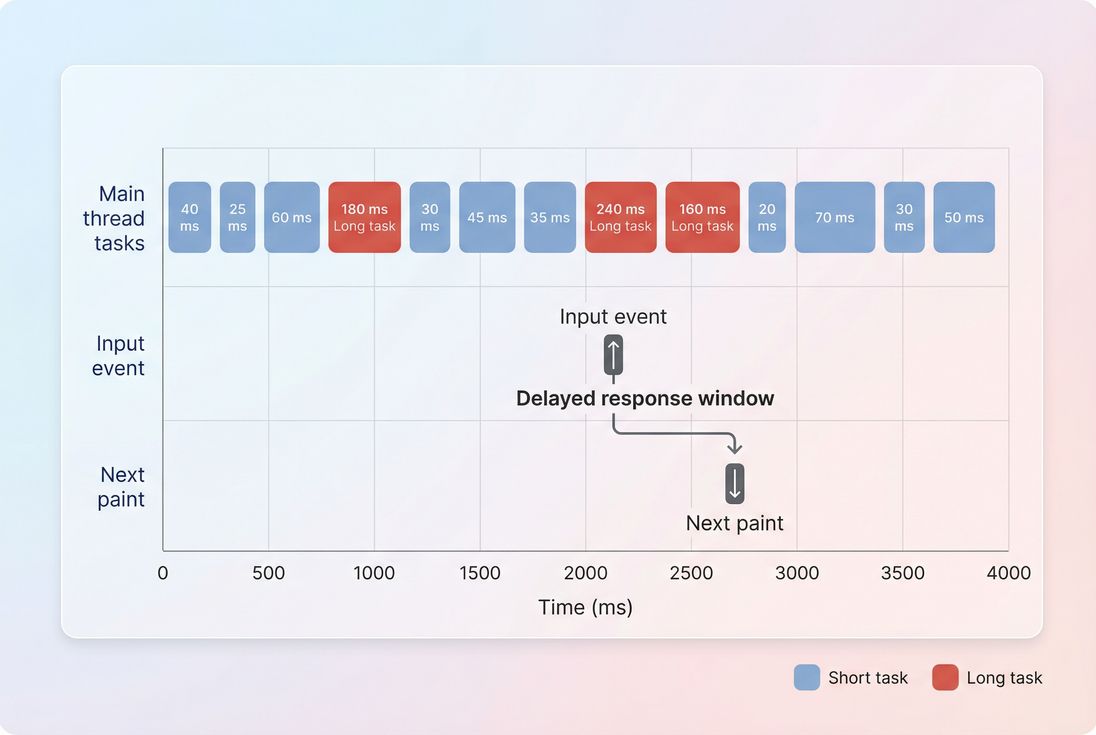
*Long JavaScript tasks overlapping user input are a common reason a page feels unresponsive. Reducing or chunking these tasks typically improves INP more than shaving a few kilobytes.*
5) Control third-party scripts like production code
A practical operating model for third-party JS:
- Inventory: list all third-party tags by page type
- Decide: for each tag, define its business owner and measurable value
- Delay: load non-essential tags after critical rendering or after interaction
- Isolate: prefer running late, limit DOM watchers when possible
- Review: remove tags that don't justify their CPU cost
Related reading: Third-party scripts and Render-blocking resources
6) Don't confuse caching with CPU fixes
Caching helps downloads, not execution.
- Browser caching and Cache-Control headers reduce repeat-visit network cost.
- But the browser still has to parse/compile/execute (sometimes cached compilation helps, but you shouldn't assume it).
Use caching, but don't expect it to "solve" high scripting time.
How to interpret changes (and avoid false wins)
JavaScript execution time improvements should be read alongside user-facing outcomes.
If execution time drops, but INP doesn't
Likely causes:
- Remaining long tasks still overlap interactions
- Heavy event handlers on key UI (filter clicks, add-to-cart)
- Third-party scripts run during interaction windows
What to do:
- Inspect long tasks and interaction paths
- Focus on breaking up tasks and reducing handler complexity
If execution time drops, but LCP doesn't
Likely causes:
- LCP is dominated by network and rendering: TTFB, images, fonts, CSS
- The LCP element is blocked by other resources in the critical rendering path
What to do:
- Check LCP breakdown
- Apply critical CSS and image optimization where appropriate
If bundle size shrinks, but execution time stays high
This is common when:
- You removed bytes but not the expensive work (hydration, DOM operations)
- You still execute too much on startup
Use this mental model:
- Bytes tell you download cost
- Execution time tells you CPU cost
- You need both for a fast mobile experience
Related: JS bundle size
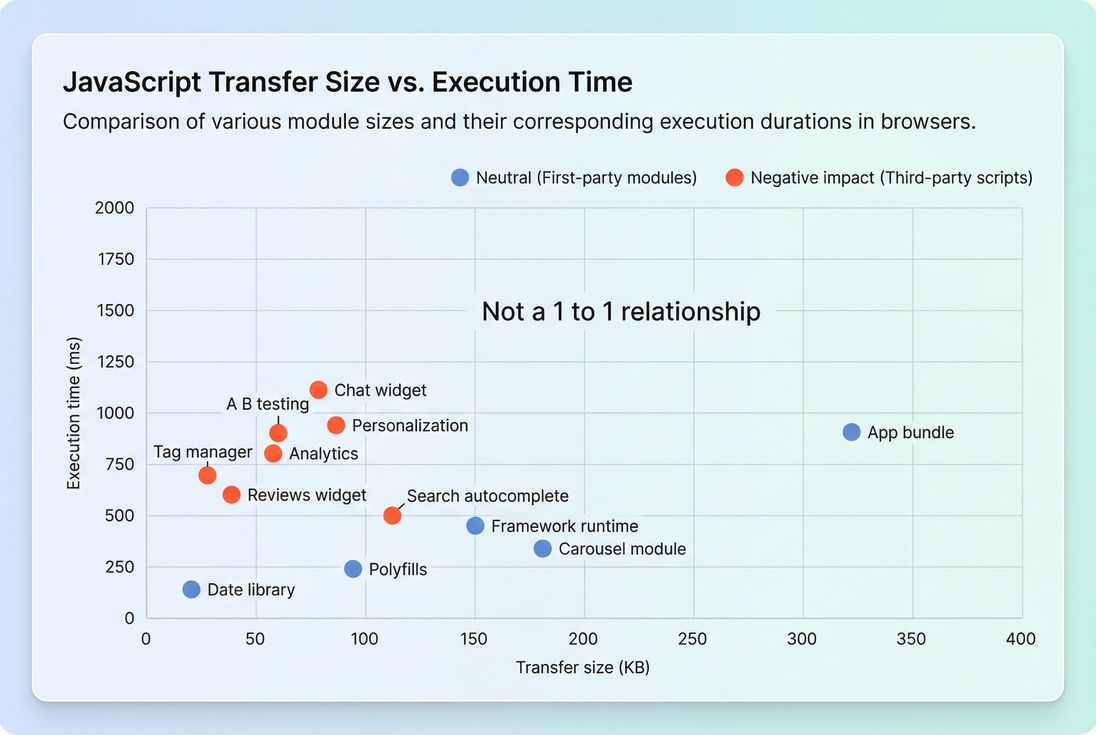
*A smaller script is not always a cheaper script. Some third-party tags and certain libraries cost far more CPU than their download size suggests.*
A practical workflow for website owners
If you want a repeatable process (not a one-time cleanup), use this approach.
Step 1: Identify the pages that matter
Pick 3–6 templates tied to revenue:
- Home
- Category/collection
- Product detail
- Cart
- Checkout step(s)
If you're optimizing SPAs, include route changes and key interactions.
Step 2: Confirm it's a CPU problem
If the page is slow, determine whether you're bottlenecked by:
- Network/server: TTFB, CDN performance
- Rendering: critical rendering path, unused CSS
- CPU/JS: execution time, long tasks, main thread work
This avoids wasting time on the wrong lever.
Step 3: Rank fixes by business and risk
A good prioritization order for most sites:
- Remove or delay third-party scripts (high impact, often low engineering risk)
- Cut unused JS (medium-high impact, medium risk)
- Code split by page (high impact, medium-high effort)
- Break long tasks / refactor hot paths (high impact, higher engineering effort)
- Framework-level changes (potentially huge impact, highest risk)
Step 4: Monitor with budgets
Performance improvements often regress quietly (a new tag, a new feature, a new dependency).
If you use PageVitals, set automated guardrails with performance budgets so releases can fail fast when scripting or related metrics exceed thresholds: /docs/features/budgets/. Also ensure you're running consistent lab tests via /docs/features/lighthouse-tests/.
The Website Owner's perspective
A budget turns performance into an operational control. Without it, JavaScript execution time tends to creep up with every campaign, integration, and "small" front-end enhancement – until mobile conversion drops and nobody can point to the cause.
Common "quick wins" (and what they really mean)
These are popular, but they don't all solve the same problem:
- Minification: helps bytes more than CPU (Asset minification)
- Compression (Brotli/Gzip): helps transfer size, not execution (Brotli compression, Gzip compression)
- Defer scripts: helps earlier rendering, may not reduce total CPU (Async vs defer)
- Remove unused JS: helps both bytes and CPU (Unused JavaScript)
- Code splitting: shifts CPU to when it's needed (Code splitting)
Use them intentionally. The win you want is usually: fewer long tasks during the first interaction window.
The bottom line
JavaScript execution time is a practical measure of how much "work" your page forces a visitor's device to do. When it's high, your site can look finished but behave slow – hurting user trust and conversion.
Optimize it by removing unnecessary code, splitting what remains, delaying non-critical execution, controlling third parties, and breaking up long tasks. Then lock the gains in with ongoing monitoring and budgets so performance doesn't slip back over time.
Frequently asked questions
For most e-commerce pages, aim for under about 1 second of main-thread scripting on a mid-tier mobile test during initial load. Above 2 seconds is usually a red flag. The more important check is long tasks: frequent 50 ms plus tasks typically correlate with worse INP and conversion.
Bundle size and execution time are related but not the same. A small bundle can still be expensive if it triggers heavy framework hydration, complex DOM work, lots of JSON parsing, or runs third-party code. Look for long tasks and high scripting time after the first render, not just download bytes.
It can improve both, depending on what is blocked. If JavaScript is delaying rendering work or the LCP element creation, LCP often improves. If the page renders quickly but feels unresponsive, you will see bigger gains in INP and Total Blocking Time. Measure before and after to confirm the bottleneck.
Start with third-party scripts that run before the user can interact or that execute on every page. Defer what can wait, and remove what does not drive measurable business value. For many sites, tag managers, chat widgets, and A B testing libraries are disproportionate sources of long tasks.
Put a performance budget in place for scripting time and long tasks, then test key pages on every release. Track regressions by page type, device profile, and route in SPAs. Treat new tags and vendor pixels as code changes with owners, review, and rollback plans.
Want to take PageVitals for a spin?
Page speed monitoring and alerting for your website. Get daily Lighthouse reports for all your pages. No installation needed.
Start my free trial