Table of contents
Server response time optimization
A slow server response time is one of the most expensive "hidden" problems on a website: it delays every pixel, increases bounce rate, lowers conversion rate, and makes your paid traffic less profitable because users wait longer before they can even start reading or buying.
Server response time is how long it takes for a user's browser to receive the first byte of the page response after requesting it. In web performance tooling, this is commonly represented as Time to First Byte (TTFB). If TTFB is slow, your page is starting the race late – no amount of front-end polishing fully fixes that.
What this metric reveals
Server response time is not "how long the whole page takes." It's the start of the page load: the delay before the browser can begin parsing HTML and discovering critical subresources (CSS, JS, hero image).
Practically, server response time reveals whether your delivery stack can produce HTML quickly and consistently. That matters because:
- A slow first byte delays everything downstream, especially Largest Contentful Paint (LCP) and perceived speed.
- Variability is often worse than averages. A few slow backend moments can dominate your p75 (75th percentile) and push you into "feels slow" territory for many users.
- It distinguishes "front-end weight" problems from "backend latency" problems. If TTFB is already 1.5s, shaving 100ms off image decode won't move the business needle much.
The Website Owner's perspective: If LCP is missing targets and TTFB is high, you should expect lower conversion rates on landing pages and slower checkout progression. That can force you to spend more on ads to hit the same revenue, or discount more aggressively because fewer users reach product detail pages fast enough to engage.
What "server response time" includes (and doesn't)
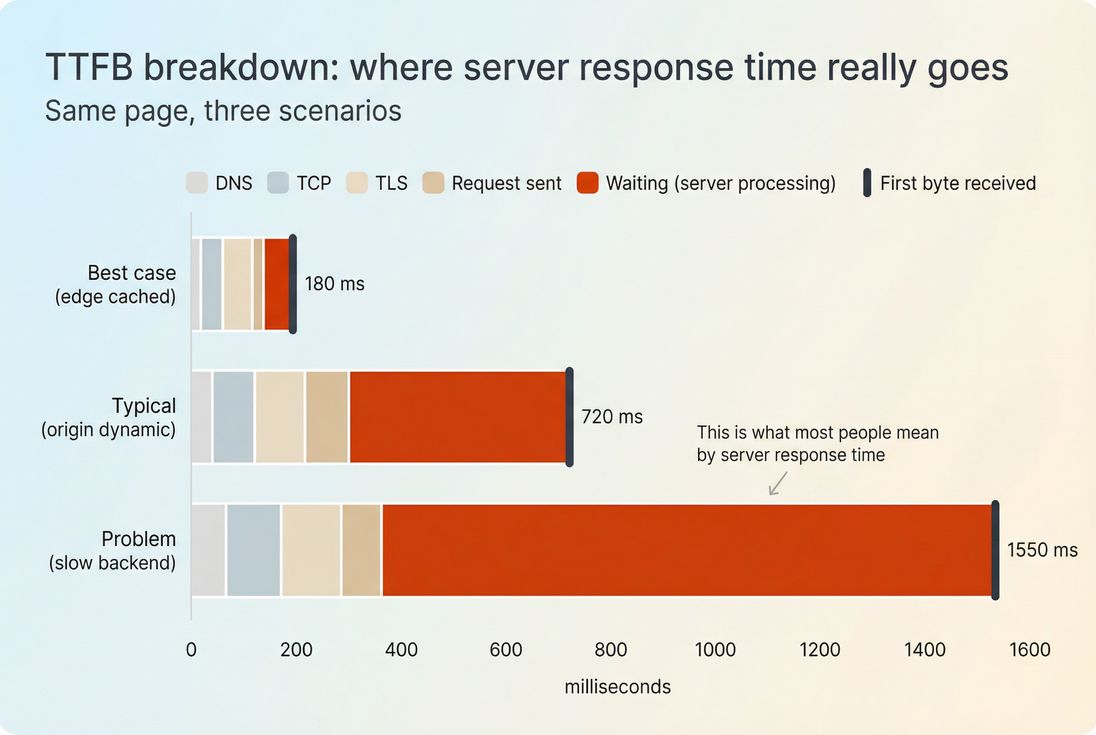
In many tools, "server response time" is shorthand for TTFB, and TTFB includes multiple phases:
- DNS lookup (finding the IP)
- TCP handshake (connecting)
- TLS handshake (security negotiation)
- Request sent
- Waiting / backend processing (server generates the response)
- The first byte arrives (start of response download)
If you're trying to optimize "the server," the most actionable slice is usually the waiting/backend processing portion. But you can't ignore the others – especially if your users are far from your origin or you're not using a CDN well. See CDN vs origin latency and Network latency.
How fast is fast enough
There's no single number that fits every site, but you can make decisions with practical thresholds.
Practical targets you can use
Use percentiles (p50 and p75), not just averages. Here are reasonable targets for most content and ecommerce sites:
| Metric (real users) | Strong | Acceptable | Risky |
|---|---|---|---|
| p75 TTFB on key pages | ≤ 800 ms | 800–1200 ms | > 1200 ms |
| p50 TTFB on key pages | ≤ 400 ms | 400–800 ms | > 800 ms |
| Cached/edge HTML TTFB (lab) | ≤ 200 ms | 200–400 ms | > 400 ms |
How to interpret this:
- If p75 is high but p50 is fine, you likely have tail latency: overloaded instances, slow queries, cache misses, or noisy neighbors.
- If both p50 and p75 are high, you likely have a baseline architecture issue: no caching, slow origin, or poor geographic distribution.
- If lab tests are fast but field data is slow, it's often geography, device/network mix, or inconsistent cache behavior. Compare Field vs lab data.
The Website Owner's perspective: p75 is the "brand experience" number. Your best customers might have fast devices and great connections, but a high p75 means a large slice of shoppers still experience delay. That shows up as lower add-to-cart rates and more abandonment – especially on mobile.
When a small change is meaningful
Server response time is noisy. A good rule for decision-making:
- Treat sustained changes of ~100–200ms at p75 on key templates (home, PLP, PDP, checkout) as meaningful.
- Treat single-day spikes as incident signals, not optimization results.
If you're working on business impact, focus first on:
- Top entry pages from SEO and paid
- Product listing and product detail
- Cart and checkout steps
(If you optimize a low-traffic blog template first, you may "win the metric" but not revenue.)
What usually makes it slow
Most slow server response time comes from one of these categories. The key is to identify which one you have before you "optimize everything."
1) Cache misses (the most common)
If HTML is generated dynamically for every request, you're paying the full backend cost repeatedly.
Typical causes:
- No full-page caching for anonymous users
- Misconfigured Cache-Control headers leading to low cacheability
- Short or ineffective cache TTL values
- Personalization applied too early (turning every page into a unique response)
High-impact fixes:
- Edge caching for HTML where possible
- Microcaching (even 1–10 seconds) to absorb bursts (sales, email campaigns, bots)
2) Slow database and backend work
If the "waiting" phase is large, it's usually backend compute or I/O:
- Unindexed queries or slow joins
- N+1 query patterns
- Excessive API calls during SSR
- Heavy middleware, feature flags, or personalization logic on every request
High-impact fixes:
- Profile and remove expensive queries on hot paths
- Add read replicas or caching layers where appropriate
- Move noncritical work off the request thread (async jobs)
3) Origin far from users (geography)
If DNS/connect/TLS dominate, the issue may be distance and connection setup, not your code.
High-impact fixes:
- Use a CDN and validate CDN performance
- Ensure keep-alive and connection reuse are working
- Reduce handshake costs: TLS handshake, TCP handshake, and DNS lookup time
4) Overloaded servers or bad autoscaling
Even well-written code slows down when servers are saturated.
Signs:
- p75 rises during traffic peaks
- Large variability by time of day
- Errors increase alongside TTFB
Fixes:
- Autoscaling tuned to CPU and request queue depth
- Right-size instances
- Protect origin with caching and bot controls
How to diagnose it without guesswork
The goal is to answer one question: Where is the time actually going? Start with a single slow page and work outward.
Step 1: Separate backend waiting vs connection time
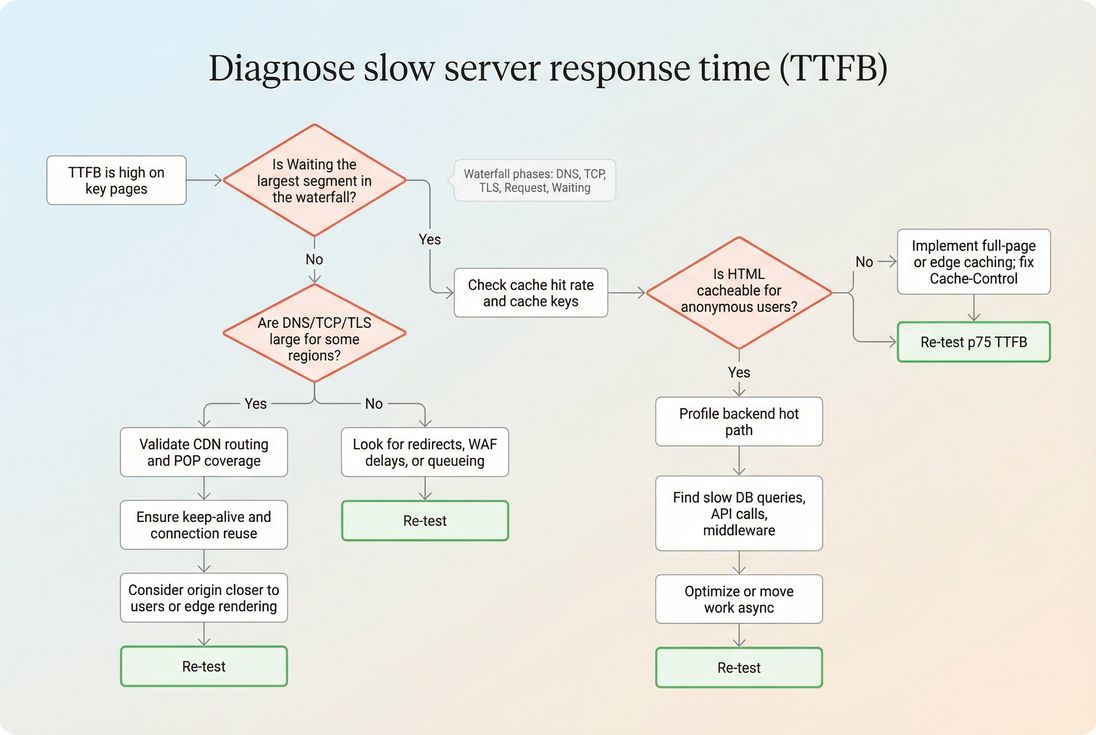
Use a waterfall view (any synthetic test tool that shows DNS/connect/TLS/request/waiting). You're looking for:
- Waiting dominates: backend work, cache misses, database, application code
- Connect/TLS dominates: geography, CDN routing, keep-alive failures
- DNS dominates: DNS provider, TTL issues, misconfiguration
If you're using PageVitals, the most direct view for this is the network request waterfall documentation view: /docs/features/network-request-waterfall/.
Step 2: Compare cached vs uncached behavior
Run tests that intentionally compare:
- Logged out vs logged in
- First hit vs repeat hit
- With/without cookies that affect cache keys
- Different regions (US/EU/APAC)
If your second hit isn't substantially faster, you may not be caching effectively, or you're varying responses too much.
Step 3: Identify "which template" is the culprit
Group pages by template type:
- Home
- Category/PLP
- Product/PDP
- Cart
- Checkout step
- Blog/article
Often one template is responsible for most of the p75 pain (e.g., PDP does inventory + pricing + recommendations + reviews on every request).
Step 4: Validate with field data
Synthetic tests are great for repeatability, but field data tells you whether real customers are suffering.
- Use CrUX data when available
- Use Real user monitoring for template-level and user-segment breakdowns
If you're in PageVitals, relevant docs to understand the views include:
- Chrome UX Report feature: https://pagevitals.com/docs/features/chrome-ux-report/
- TTFB metric reference: https://pagevitals.com/docs/metrics/time-to-first-byte/
Fixes that usually move the needle
If you want the biggest improvements with the least wasted effort, prioritize in this order.
1) Make more HTML cacheable
For many sites, the fastest response is the one you don't regenerate.
Actions:
- Serve anonymous traffic from edge cache where possible (edge caching)
- Ensure correct Cache-Control headers and avoid accidental
no-store - Reduce cache key variation (cookies, query params, headers)
- Consider microcaching for dynamic HTML during bursts
What to expect:
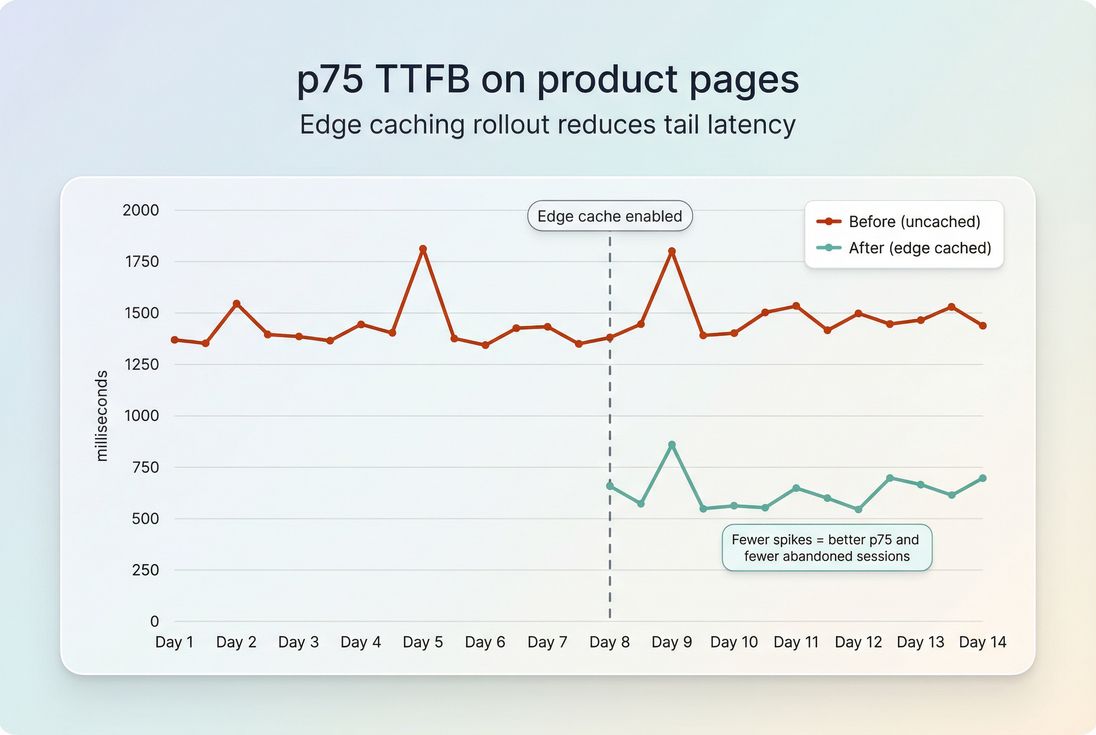
- TTFB drops fast (often hundreds of milliseconds)
- Origin load drops, making tail latency better too
2) Reduce backend work per request
If you can't cache (or can't cache everything), then reduce time spent building responses:
Actions:
- Profile and eliminate slow DB queries (indexes, query shape, fewer round trips)
- Collapse sequential API calls into parallel where safe
- Avoid doing personalization before sending critical HTML
- Move noncritical work (logging, analytics calls, recomputation) off the request path
What to expect:
- Smaller but consistent improvements
- Better stability under load (p75 improves)
3) Use the CDN correctly (not just "have a CDN")
A CDN helps only if content is cacheable and traffic is routed efficiently.
Actions:
- Confirm edge hits for HTML and critical assets
- Compare CDN vs origin latency using region tests (CDN vs origin latency)
- Ensure HTTP keep-alive works end-to-end (connection reuse)
- Eliminate unnecessary redirects (each redirect adds another TTFB)
4) Tighten connection overhead
When connection setup is a meaningful slice of TTFB:
Actions:
- Improve DNS performance (DNS lookup time)
- Reduce TLS handshake cost (TLS handshake)
- Prefer modern protocols where supported (HTTP/2 performance and HTTP/3 performance)
Client-side hints like preconnect can help certain third-party origins, but for your main document, the bigger wins typically come from caching and origin/CDN placement.
5) Compress and minimize payloads (secondary for TTFB)
Compression doesn't usually change "waiting" time, but it can reduce the time from first byte to usable bytes for large responses and improve overall load.
Actions:
- Enable Brotli compression (or Gzip)
- Keep HTML lean by avoiding giant inline JSON blobs
- Minify assets where appropriate (asset minification)
How to interpret improvements (and avoid false wins)
Server response time optimization is successful when it changes user experience and outcomes, not just a lab number.
Tie TTFB to what users actually feel
TTFB is upstream of most metrics, but it doesn't guarantee a good experience. After changes, validate:
- TTFB improved (p75, by template, by region)
- LCP improved (especially on entry pages)
- INP and main-thread work didn't regress due to new scripts or heavier hydration
See INP and reduce main thread work.
Watch for "cache illusions"
It's easy to accidentally test only the best case (warm cache). Guardrails:
- Always test cold and warm scenarios
- Measure logged-in vs logged-out
- Validate cache hit rate during real traffic peaks
The Website Owner's perspective: If the only time the site is fast is when caches are warm during low traffic, your customers still suffer during launches and promotions – the exact moments you're paying to acquire attention. Consistency at p75 is what protects revenue during spikes.
How to keep server response time fast
Optimizing once is not the hard part. Staying fast through content growth, campaigns, and releases is.
Set a simple operating cadence
- Pick 5–10 key URLs/templates (home, top category, top product, cart, checkout step)
- Track p75 TTFB weekly
- Alert on sustained shifts (e.g., p75 +200ms for 24–48 hours)
- Review changes against deploys, infrastructure events, and third-party changes
If you use PageVitals, performance budgeting and CI/CD automation are documented here:
- Performance budgets: https://pagevitals.com/docs/features/budgets/
- CI/CD options: https://pagevitals.com/docs/ci-cd/ (plus GitHub Actions and CLI under that section)
Common regression sources to watch
- New personalization logic applied to anonymous pages
- Added middleware or WAF rules increasing processing time
- Database growth without new indexes
- Cache key explosions from new cookies or query parameters
- Traffic mix changes (more mobile, more distant regions)
Pair server work with front-end work
Server response time is only one lever. Many sites get the best business result by pairing:
- Faster TTFB (backend + caching) with
- Smaller critical payloads and less render blocking work
See critical rendering path, critical CSS, and render-blocking resources.
Quick decision summary
- If TTFB is high and Waiting dominates: prioritize caching and backend profiling.
- If TTFB is high and TLS/connect dominates: prioritize CDN routing, connection reuse, and origin placement.
- If TTFB improved but LCP didn't: your bottleneck likely moved to render blocking CSS/JS or large LCP resources.
For the "what" and "why" of the metric itself, see Server response time and TTFB.
Frequently asked questions
For most ecommerce pages, aim for a p75 TTFB under 800 ms for real users, with your primary pages closer to 200 to 500 ms when caching is effective. If uncached pages are consistently over 1 second, shoppers will feel it and LCP often suffers.
It usually helps, especially LCP, because the browser cannot render meaningful content until the HTML arrives. But it is not automatic: heavy render blocking CSS, large images, or slow JavaScript can still dominate. Think of faster server response time as removing the first bottleneck, not finishing optimization.
Use a request waterfall and separate waiting time from DNS, TCP, and TLS phases. If waiting is large, the server or origin processing is the issue. If connect and TLS dominate for distant regions, it is more about geography, CDN routing, or connection setup.
The biggest wins typically come from caching: full page caching, edge caching, microcaching, and fixing cache headers. After that, reduce backend work per request by optimizing database queries, removing expensive middleware, and moving noncritical work to async jobs. Hardware upgrades help, but often last.
Track p50 and p75 TTFB by page type and region, plus cache hit rate, error rate, and origin latency behind the CDN. Set release budgets for TTFB and alert on sustained shifts, not one off spikes. Pair lab tests with field data to avoid blind spots.
Want to take PageVitals for a spin?
Page speed monitoring and alerting for your website. Get daily Lighthouse reports for all your pages. No installation needed.
Start my free trial