Table of contents
Total blocking time (TBT)
A "fast-looking" page that won't respond is where conversions quietly die: users click Add to cart, nothing happens, they click again, the UI stutters, and trust drops. Total Blocking Time (TBT) is one of the fastest ways to spot this kind of "looks loaded, feels broken" experience during testing.
Total Blocking Time (TBT) is the total time your page's main thread is blocked by long tasks (over 50 ms) during page load, preventing the browser from responding to user input. It's a lab metric (synthetic tests), most commonly reported by Lighthouse and tools like PageSpeed Insights.
What TBT reveals about user friction
TBT is not a "speed" metric in the traditional sense. It's a responsiveness under load metric: while the browser is parsing, executing JavaScript, and doing layout work, the main thread can't reliably process user input.
When TBT is high, real users experience:
- Taps that don't register (or register late)
- Delayed dropdowns, menu opens, and accordions
- Janky scrolling while the page "finishes initializing"
- Rage clicks (multiple repeated taps)
- Form inputs that lag behind typing
The Website Owner's perspective: TBT is the "lost intent" metric. If a shopper clicks a CTA and nothing happens, you don't just lose that click – you lose confidence, which shows up as lower add-to-cart rate, lower checkout completion, and more support complaints like "your site is broken."
TBT is especially useful because it often pinpoints issues that are invisible if you only watch rendering metrics like FCP and LCP. A page can paint quickly and still be hard to use.
How TBT is measured in Lighthouse
TBT comes from Long Tasks on the main thread. Any task taking more than 50 ms is considered "long," because it blocks input handling and rendering opportunities.
Measurement window (important):
- The counting starts at First Contentful Paint (FCP).
- It ends when the page is considered reliably interactive (many tools historically called this Time to Interactive).
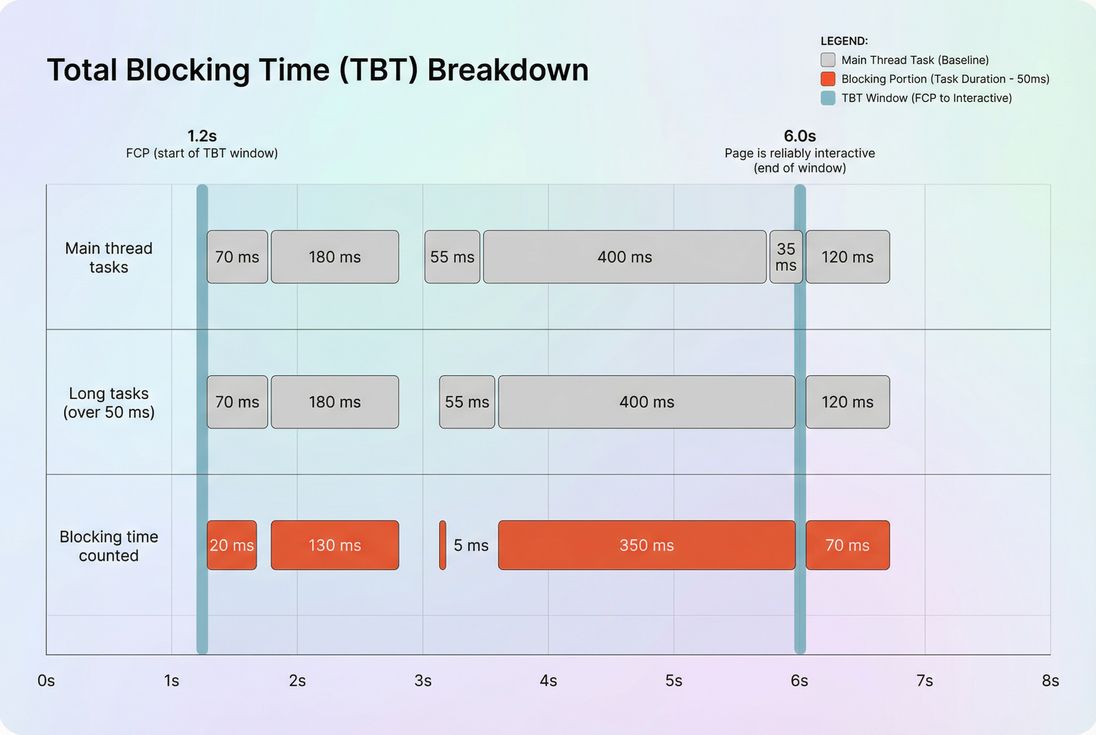
Within that window, Lighthouse:
- Finds long tasks (main-thread tasks > 50 ms).
- For each long task, counts only the portion beyond 50 ms as "blocking time."
- Sums those blocking portions into TBT.
Example (no formulas, just mechanics):
- A 55 ms task contributes 5 ms to TBT.
- A 180 ms task contributes 130 ms to TBT.
- A 35 ms task contributes 0 ms to TBT (not long).
Lab metric vs field reality
TBT is measured in lab tests (synthetic conditions), while your business outcomes depend on real users (devices, networks, CPU throttling, background tabs, extensions).
That's why you should interpret TBT alongside:
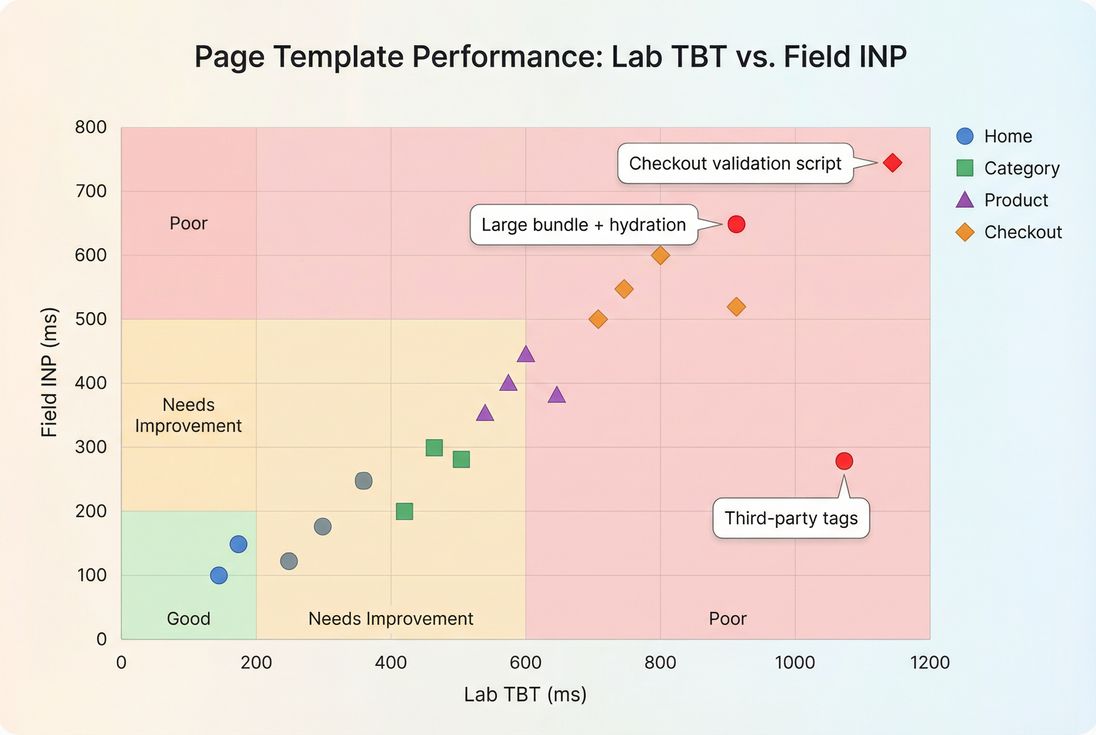
- Field metrics like INP (Core Web Vitals responsiveness)
- Lab diagnostics like JavaScript execution time and Long tasks
- The broader context of Field vs lab data
What is "good" TBT for decision-making?
Use Lighthouse's widely adopted breakpoints as your default operating thresholds:
| TBT (lab) | Interpretation | What users often feel |
|---|---|---|
| 0–200 ms | Good | Site responds quickly even while loading |
| 200–600 ms | Needs improvement | Occasional ignored taps, small delays |
| 600+ ms | Poor | Noticeable lag, rage clicks, janky UI |
How to use these benchmarks in the real world:
- Template matters. A blog post can tolerate more script than a checkout step. Hold transactional pages to stricter targets.
- Mobile matters more. Mid-range phones amplify long tasks; a "fine on desktop" TBT often becomes "broken on mobile."
- Track deltas, not just absolutes. A jump from 150 → 350 ms after a tag release is worth investigating even if 350 ms isn't catastrophic yet.
The Website Owner's perspective: Treat 200 ms as your "don't make it worse" line for revenue pages. It's much easier to prevent TBT regressions than to claw back performance after multiple teams have added "just one more script."
What usually drives high TBT
Almost all TBT pain is main-thread contention. The browser is busy doing work that can't be interrupted, so input waits.
Here are the most common causes, in the order they tend to appear on real sites.
1) Too much JavaScript shipped up front
Large bundles create long tasks from:
- Parsing and compiling JS
- Executing module initialization
- Framework hydration work
- Running polyfills and boot code
Related concepts and fixes:
Practical tell: TBT spikes coincide with a release that "didn't change design much" but added features, analytics, or personalization logic.
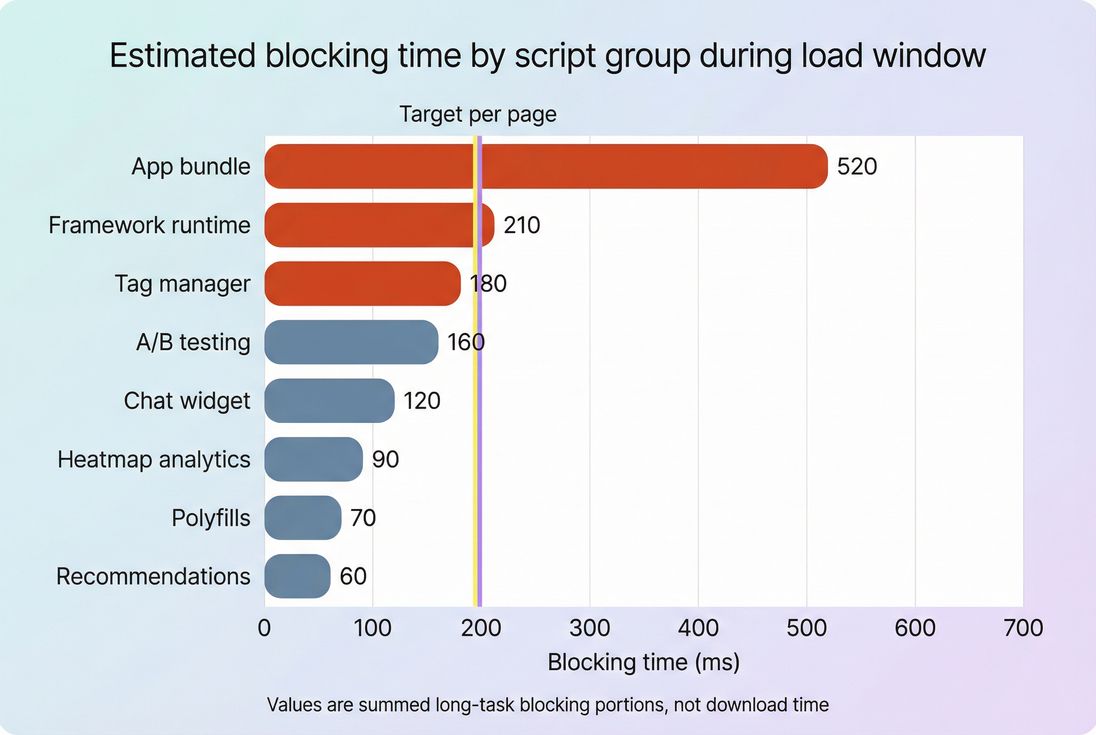
2) Third-party scripts and tag bloat
Third-party scripts are a top source of unpredictable long tasks because:
- They execute on your main thread.
- They often chain-load more scripts.
- Their behavior changes without your deployment.
Start here:
- Third-party scripts
- HTTP requests (more tags = more work)
Practical tell: marketing pixels, A/B testing, and chat widgets often add short "bursty" long tasks that sum to hundreds of milliseconds.
3) Render-blocking and early execution order
If you execute too much code before the page becomes usable, you compress a lot of main-thread work into the most sensitive moment (right after initial render).
Helpful related topics:
Practical tell: the page paints, but clicking the menu right away feels delayed.
4) Layout and style recalculation bursts
Not all TBT comes from JS. It can also come from forced synchronous layout, excessive DOM work, and heavy style calculations.
Related topics:
- Layout instability
- Zero layout shift (good CLS practices often reduce churn)
Practical tell: interactions that trigger large DOM changes (filters, sticky headers, complex product galleries) lag during load.
How to debug TBT without guesswork
TBT is only actionable when you can answer: which tasks caused it, and what code caused those tasks?
Step 1: Confirm it's not a "measurement mismatch"
Before you chase code:
- Compare lab runs across consistent conditions (same device profile, throttling, location).
- Check whether the change is isolated to certain pages or global.
- If you have it, compare against field responsiveness (INP) to prioritize what affects users.
Background reading:
Step 2: Look for long tasks, not "slow pages"
TBT is literally a long-task sum, so focus on:
- A few massive long tasks (e.g., 400–900 ms)
- Many medium long tasks (e.g., 80–200 ms repeated)
If you're using PageVitals Lighthouse reporting, start with the metric definition and drilldown in the docs:
- Total Blocking Time metric
- Long tasks opportunity
- Network request waterfall (to connect scripts downloaded to the work they trigger)
Step 3: Attribute blocking to owners (your code vs vendors)
This is where busy teams win time back: assign blame correctly.
A simple attribution model that works operationally:
- First-party bundle (your JS): engineering fix (split, defer, reduce).
- Tag manager / vendors: marketing ops fix (remove, delay, gate).
- Framework/hydration: architecture fix (islands, partial hydration, SSR tuning).
The Website Owner's perspective: The fastest TBT wins usually come from deleting or delaying something, not rewriting your site. Make it someone's job to own tags, enforce standards, and remove tools that don't pay for their performance cost.
How to reduce TBT in ways that stick
The best TBT improvements reduce main-thread work during the critical window. In practice, that means shifting work later, splitting it up, or removing it.
1) Ship less JavaScript to begin with
High-confidence actions:
- Remove unused modules and dead code (Unused JavaScript)
- Reduce bundle size (JS bundle size)
- Split routes and components (Code splitting)
What it changes in TBT terms: fewer long tasks from parse/compile/execute, and fewer initialization bursts after FCP.
2) Change when JavaScript runs
If code doesn't need to run before first interaction, don't run it there.
Practical patterns:
- Use
deferfor non-critical scripts and avoid blocking synchronous loads (Async vs defer) - Delay non-essential initialization until after the page is stable (e.g., after first user interaction)
- Load below-the-fold features later (Above-the-fold optimization)
What it changes: you move long tasks outside the TBT window or spread them so they don't stack.
3) Put third parties on a budget
Third parties are where TBT often gets re-broken.
Policies that work:
- Require a performance review for every new tag
- Gate tags by page type (don't load everything on checkout)
- Remove "nice to have" tools from revenue pages
- Prefer server-side approaches where possible (e.g., analytics collection that doesn't execute heavy client JS)
Related reading:
If you use PageVitals, enforce this operationally with:
- Performance budgets (so TBT regressions fail builds or trigger alerts instead of quietly shipping)
4) Reduce main-thread rendering work
Even with the same JS, you can cut blocking by reducing expensive UI work:
- Reduce forced layout and large DOM updates
- Avoid heavy synchronous loops during startup
- Keep initial render minimal; progressively enhance
Related topic:
5) Fix the easy "supporting" wins
These don't directly lower TBT as much as code changes, but they reduce the pressure to execute big chunks of work early:
- Minify assets (Asset minification)
- Remove unused CSS (Unused CSS)
- Improve delivery so critical resources arrive sooner (CDN performance, Brotli compression, Browser caching)
How to interpret TBT changes over time
TBT is most valuable as a trend and regression signal.
When a TBT improvement is "real"
It's likely real if:
- Multiple runs improve, not just one
- The improvement appears on the templates where the change shipped
- Long tasks are fewer or shorter (not just shifted around)
- Field responsiveness (INP) stabilizes or improves afterward
When a TBT improvement is misleading
Be cautious if:
- TBT dropped but users still complain about lag (check INP)
- TBT dropped because the "interactive" point moved earlier, but the page still does heavy work right after
- A/B tests or tags are conditionally loaded and your test run didn't include them
The Website Owner's perspective: Use TBT to catch "we shipped something that makes the site feel broken," then use INP to confirm "real users are actually suffering." Together, they prevent both overreacting to lab noise and ignoring real revenue leaks.
How TBT fits into Core Web Vitals work
TBT itself is not a Core Web Vital. But it's a practical engineering metric because it points directly to long tasks and main-thread blocking – the same root causes that often hurt INP.
A sensible workflow for busy teams:
- Use lab tests to keep TBT under control on every release (prevent regressions).
- Use field data to validate INP improvements (user reality).
- Balance with rendering metrics like LCP and stability metrics like CLS.
If you need a single operational takeaway: TBT is your early-warning system for responsiveness problems.
Related reading
- Long tasks
- JavaScript execution time
- Third-party scripts
- Field vs lab data
- Interaction to Next Paint (INP)
Frequently asked questions
In Lighthouse-style lab tests, aim for under 200 ms on key templates like home, category, product, and checkout steps. 200 to 600 ms is a warning zone where shoppers may feel taps and scrolls lag. Over 600 ms often correlates with noticeable unresponsiveness and higher abandonment on mobile.
LCP is mostly about getting a key element rendered quickly, while TBT is about keeping the main thread free for input. It is common to improve LCP with aggressive client-side rendering or heavier scripts that then increase JavaScript execution time and long tasks, raising TBT.
Yes, but treat TBT as lab-only diagnosis. INP is the user-facing Core Web Vitals responsiveness metric, and it is measured in the field. TBT is a strong lab signal for main-thread contention and long tasks, making it useful for catching regressions before they impact INP.
The most common causes are new or expanded third-party tags, personalization scripts, A/B testing tools, large JavaScript bundles, and heavy framework hydration. Spikes can also come from shipping more code to more users, like enabling a feature flag globally or removing code splitting.
Compare the business value of the script to its incremental blocking time on your highest-traffic pages. If a tag adds 200 to 400 ms TBT on mobile, it may reduce conversion enough to negate its benefit. Prefer server-side, delayed, or conditional loading for non-critical tools.
Want to take PageVitals for a spin?
Page speed monitoring and alerting for your website. Get daily Lighthouse reports for all your pages. No installation needed.
Start my free trial