Table of contents
Removing unused JavaScript
Unused JavaScript is one of the quietest ways a site bleeds revenue: customers wait longer, taps feel laggy, and "fast enough" competitors win the next click. The pain is rarely visible on a developer's laptop – but it shows up on real mobile devices as slower renders and worse interaction quality.
Removing unused JavaScript means stopping the browser from downloading, parsing, and executing code that isn't needed for what the user is doing right now (especially the first view). Sometimes you delete dead code. More often, you delay it, split it by route, or load it only after intent.
Most sites don't have a JavaScript problem on one page – they have a "loaded everywhere" problem, where large chunks are unused on the first view.
What unused JavaScript costs
Unused JavaScript doesn't just waste bandwidth. It taxes the browser in multiple ways, and those costs stack up – especially on mid-range phones.
The real costs you pay
Download time
Even with Brotli compression and HTTP/2, extra JS bytes compete with images, CSS, and fonts.Parsing and compiling
The browser must parse most JS it downloads. Large bundles add CPU work before the page becomes reliably usable.Execution and main thread contention
The most damaging part is often execution: libraries initialize, set up observers, run polyfills, attach event handlers, and do hydration work. This increases main thread work and raises the chance of long tasks.Indirect impact on Core Web Vitals
- More JS can delay FCP and impact LCP by keeping the browser busy during the critical rendering path.
- Heavy JS and long tasks can degrade responsiveness, affecting INP.
- It can also increase total blocking time in lab tools.
The Website Owner's perspective: If your paid traffic lands on pages that ship lots of unused JS, you're paying twice – once for the click, and again in lost conversion because the page feels slow or unresponsive on mobile.
How tools measure it
"Unused JavaScript" is not a single web standard metric like LCP. It's typically an audit produced by tools like Lighthouse and Chrome DevTools, based on what code actually executes during a test.
What "unused" usually means
Most audits label bytes as "unused" when the code in a JS file was not executed during the measured window, which typically includes:
- Initial navigation and rendering
- A short post-load period (idle time)
- Sometimes limited interaction (varies by tool and setup)
Tools use runtime coverage data to estimate how much of each script was executed. Then they map that to an estimated "byte savings" if that unused portion were not shipped (or were deferred).
Why the number can be misleading
Unused JS audits are directionally correct, but you should interpret them carefully:
- A script can be unused now but required later. Example: account features loaded on a product page.
- Minified bundles blur ownership. One file can contain framework runtime, app code, and multiple features.
- Execution cost isn't equal to bytes. A small script can be expensive if it triggers heavy work (layout, parsing, initialization). Pair this audit with JS execution time and JS bundle size.
Lab vs field interpretation
Lab audits tell you what could be improved under a consistent test setup. Field data tells you what users experience across devices, networks, and navigation paths. If you're new to the distinction, review field vs lab data and CrUX data.
The Website Owner's perspective: I don't need the unused JS number to be perfect. I need it to be consistent enough to answer: did the last release make the site heavier, and did it likely hurt mobile conversions?
Why it happens on real sites
Unused JS usually comes from reasonable decisions that compound over time.
Common causes
1) "One bundle for everything" builds
Without code splitting, many sites ship a large app bundle that includes code for routes users may never visit.
2) Over-hydration and heavy frameworks
Modern frameworks can ship a lot of runtime and hydration logic. If most of the first view is static content, shipping a full interactive app upfront is often overkill.
3) Third-party scripts loaded globally
Chat widgets, heatmaps, tag managers, affiliate tools, A/B testing platforms – many are added site-wide and load early. See third-party scripts.
4) Feature flags and experiments
Businesses keep old code "just in case," or ship multiple variants at once.
5) UI libraries and polyfills
Icon packs, date libraries, and broad polyfills are frequent offenders – especially when the site only uses a small subset.
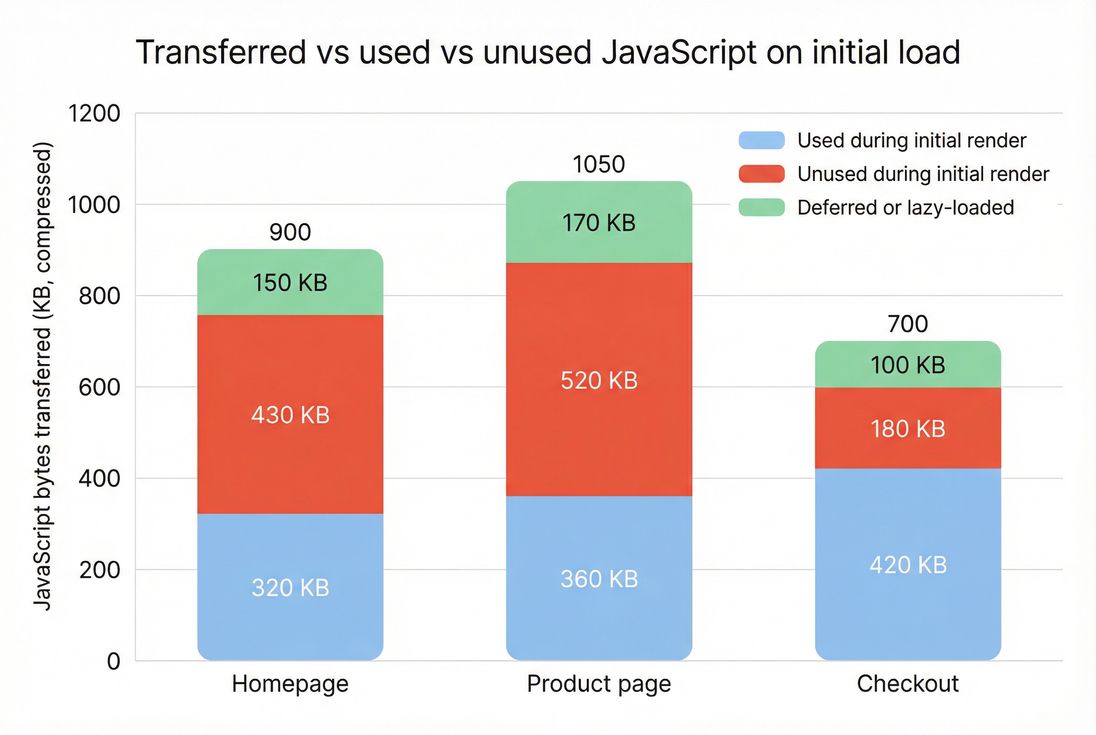
A concrete e-commerce scenario
Your homepage needs: header, navigation, hero, product grid, and search.
But the bundle includes: returns portal logic, account dashboards, checkout validation, reviews moderation UI, and admin-only components – because they're all part of the same app build.
Result: customers download and parse code unrelated to buying, and your first impression gets slower.
How to decide what to remove
The best approach is triage: focus on what's loaded early, loaded often, and costly on mobile.
Start with the pages that matter
Prioritize templates that receive the most paid or organic traffic and drive conversions:
- Homepage
- Category/collection pages
- Product detail pages
- Cart
- Checkout (often sensitive to third-party tags)
Then look at which scripts are loaded on those pages and how much is unused.
Practical benchmarks for decisions
These are not universal standards, but they work well for prioritization:
| Signal | What it usually means | What to do next |
|---|---|---|
| High unused bytes in a global bundle | You're shipping features for other routes | Add route-level code splitting and lazy-load features |
| High unused bytes in third-party scripts | Vendor loads broadly or too early | Gate by consent/intent, defer, or remove |
| Low unused bytes but high execution cost | Code runs too much on load | Reduce initialization, split work, remove expensive libraries |
| Unused bytes mostly on desktop but worse on mobile | CPU bound on mobile | Re-test with mobile throttling and focus on main thread |
Use the waterfall to see what blocks early
If unused JS is loaded before the first meaningful render, it can interfere with above-the-fold optimization and create render-blocking resources. The network request waterfall view is ideal for validating which scripts arrive early and how they interact with critical assets.
The Website Owner's perspective: If a tag or library is on every page, it must justify itself with measurable business value. If it's only valuable on a subset of pages, it should only load on those pages.
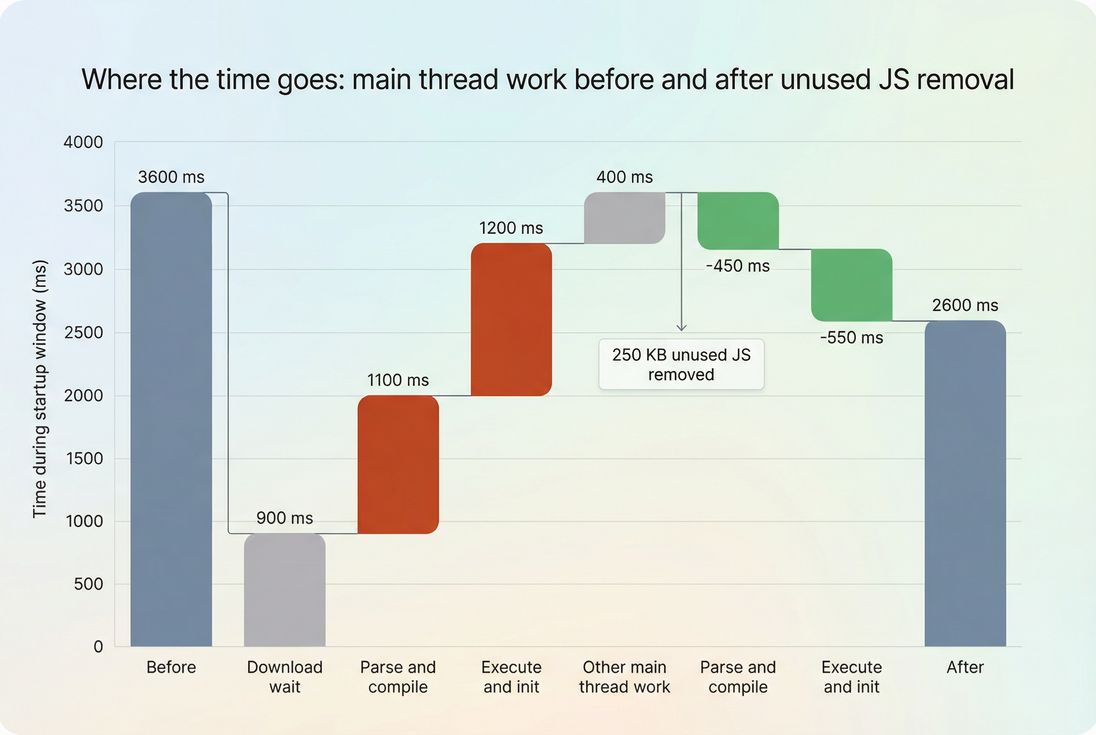
Removing unused JS helps most when it reduces parse/execute work – not just transfer size – because that frees the main thread for rendering and input.
Fixes that work in production
"Remove unused JavaScript" can mean four different strategies. Most teams use a mix.
1) Delete truly dead code
This is the cleanest win, but it's not the most common.
- Remove unused components, routes, and feature-flagged code that will not return.
- Remove unused dependencies from package manifests.
- Replace heavy libraries with lighter alternatives when you only use a small subset (common with date/time and utility libraries).
This improves both transfer size and execution cost.
2) Split bundles by route and feature
This is the most reliable strategy for large sites.
- Split by route: product page code should not ship on the homepage.
- Split by feature: reviews, recommendations, wishlists, and chat should load when needed.
This is exactly what code splitting is for: make the initial route lean, and load the rest later.
Tip: If your site is a SPA, consider navigation behavior too. Some unused JS is "future use" after the first route. That's fine – just don't load it before it's needed.
3) Defer and delay non-critical scripts
Even when you can't split easily, you can often change when scripts load:
- Use
deferfor scripts that don't need to run before HTML parsing completes. - Use
asynccautiously; it can execute at unpredictable times and still contend with rendering. See async vs defer.
Common "delay" patterns that work:
- Load chat/help widgets only after user scrolls or after a short idle period.
- Load analytics after the first paint (if business policy allows).
- Load A/B testing scripts only on pages in the experiment.
4) Control third-party impact
Third-party scripts are often both unused (early) and expensive (always running).
Actions that usually pay back quickly:
- Audit and remove duplicates (multiple analytics, old pixels).
- Load tags only on the templates that need them.
- Delay until consent when applicable.
- Prefer server-side tagging when it reduces client work (depends on setup).
If third parties are hurting performance, look beyond unused bytes: they can create HTTP requests, add network contention, and extend main-thread work.
Supporting optimizations (don't confuse them with removal)
These help, but they are not substitutes for not shipping code:
- Asset minification
- Brotli compression or Gzip compression
- Strong caching via Cache-Control headers and browser caching
- CDN improvements: CDN performance and edge caching
Compression and caching reduce transfer cost, but they don't eliminate parse/execute overhead on every navigation.
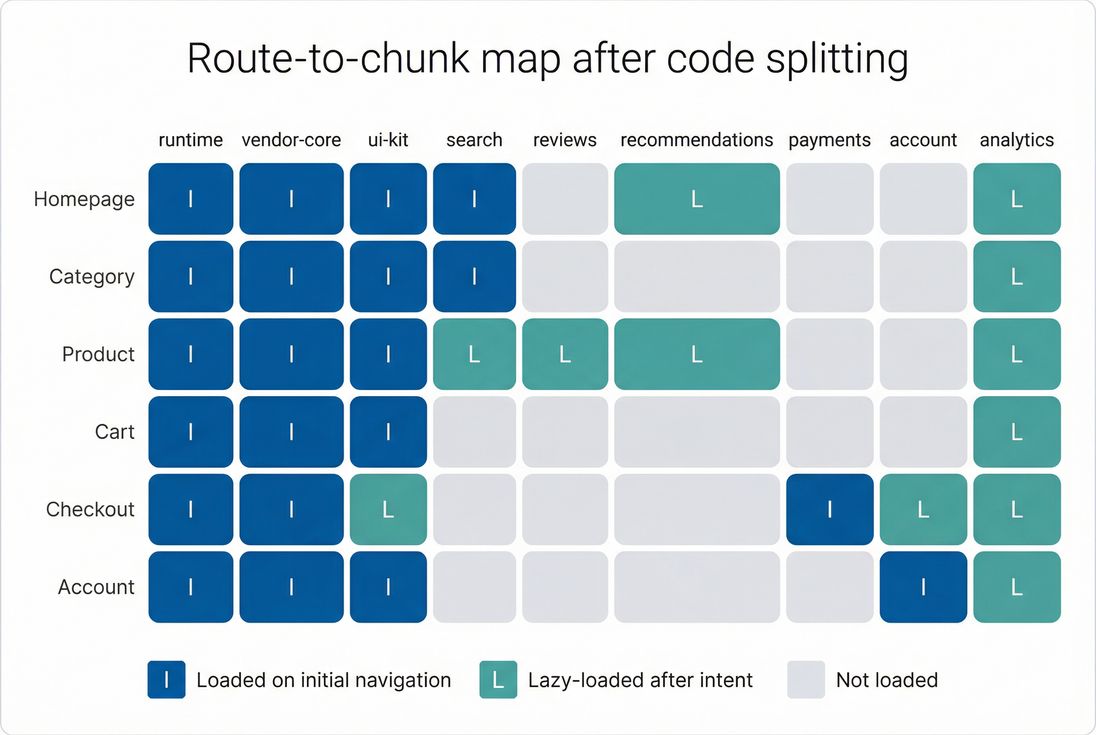
A simple route-to-chunk map helps teams confirm that optional features truly load only where they add value.
How to keep it from returning
Most regressions happen slowly: a tag here, a library there, a new "global" component, and suddenly every page ships 300 KB more JS than last quarter.
Set budgets that match business priorities
Use performance budgets for the templates that matter most (landing pages and conversion flow). Budgets should include at least:
- Total JS bytes on initial load
- Unused JS bytes (or unused percentage)
- Main-thread metrics like execution time and long tasks
If you use PageVitals, its performance budgets can help you enforce thresholds and catch regressions before they hit production.
Verify fixes with more than one view
After a change, validate across:
- Different templates (homepage vs product vs checkout)
- Mobile throttling (CPU constraints surface JS problems)
- Navigation types (first load vs repeat views)
Also confirm you didn't just "hide" the problem by moving costs later in a way that hurts UX (for example, deferring essential functionality that users expect immediately).
Keep third parties on a leash
At minimum, do a quarterly tag audit:
- What does each script do?
- Where does it load?
- What is the measurable value?
- What is the performance cost?
If you can't answer those, it shouldn't be globally shipped.
The Website Owner's perspective: This is governance, not heroics. The goal is to keep your "site tax" low so every future campaign, product launch, or seasonal peak starts from a fast baseline instead of fighting technical debt.
Related concepts to strengthen results
If you're tackling unused JS, these topics usually help you finish the job:
- Code splitting (primary lever)
- Third-party scripts (common root cause)
- Main thread work and long tasks (what users feel)
- Render-blocking resources and critical CSS (protect early rendering)
- Core Web Vitals (how performance maps to UX outcomes)
Frequently asked questions
As a practical rule, if more than about one third of your JavaScript bytes are unused on initial load, you are likely paying a noticeable speed and UX tax on mobile. In Lighthouse-style audits, seeing 200 to 800 KB of unused JS is common. A good target is under 150 KB unused on key landing pages.
It can improve both, but through different mechanisms. Less JavaScript reduces download and parse delay, which helps earlier paints and can support LCP by freeing the main thread sooner. It also reduces long tasks and event handler overhead, which tends to improve responsiveness signals like INP. Mobile and mid-range devices benefit most.
Most tools define unused as not executed during the measured window, typically the initial page load and a short idle period. Checkout logic, chat widgets, A/B testing, and account features may be needed later, but still count as unused early. The fix is usually deferring or code splitting, not deleting business-critical features.
Start with a Lighthouse test and sort the unused JavaScript opportunity by potential savings. Then validate in DevTools Coverage to see which files have large unused percentages. Combine that with a bundle analyzer to map big files to sources, such as frameworks, UI libraries, or third-party tags. Prioritize files loaded on every page.
Set a JavaScript performance budget for key templates and enforce it in CI. Track both total JS bytes and main-thread execution time because a small script can still be expensive to run. Review third-party tags quarterly, and require every new tag or library to justify where it loads, when it loads, and what it replaces.
Want to take PageVitals for a spin?
Page speed monitoring and alerting for your website. Get daily Lighthouse reports for all your pages. No installation needed.
Start my free trial