Field Tests (RUM) filters
Field Tests, also known as Real User Monitoring (RUM), provide you with insights from real visitors to your website. Unlike synthetic tests, which simulate visits, RUM measures actual browser experience across various devices, regions, and network conditions. With RUM, you can identify performance bottlenecks and optimize your site based on real-world data.
PageVitals offers a robust set of filters to help you analyze specific segments of traffic, pinpoint issues, and fine-tune performance optimizations. Below is a detailed breakdown of all available filters and options for customizing your reports.

Filters available in all Field Test features
Field Tests allow you to filter data in many ways, ensuring that you can focus on the segments that matter most. The following are the key filters available for RUM:
1. Date Range
- Description: Select a specific time period to analyze your RUM data.
- Options: Custom ranges, including last 7 days, last 30 days, or custom date ranges.
2. Device
- Description: Filter data by the device type.
- Options: Desktop, Mobile, Tablet.
3. Region / Country
- Description: Analyze performance based on user location.
- Options: Country or region (e.g., North America, Europe).
4. Browser
- Description: Filter by the browser used by your visitors.
- Options: Chrome, Firefox, Safari, Edge, etc.
5. Operating System
- Description: Filter by the operating system used by your visitors.
- Options: Windows, macOS, iOS, Android, etc.
6. Page URL
- Description: Focus on specific page URLs for a detailed breakdown of performance.
- Options: Custom URLs or URL patterns.
7. Tags
- Description: Use custom tags to categorize your traffic. Tags can be set via JavaScript.
- Example Tags: 'summer-campaign-2024', 'logged-in', 'beta-user'.
8. Referrer Type
- Description: Understand where your traffic is coming from.
- Options:
- External Link: Users from external sites.
- Internal: Users navigating from other pages on your site.
- None: Direct traffic or unknown referrer type
9. Navigation Type
- Description: Analyze different types of page loads. Regular navigations are most common, but it's important to be able to distinguish the performance of them versus back/forward clicks, reloads etc.
- Options:
- Navigation
- Back/Forward
- Back/Forward from Cache
- Reload
- Soft-Navigation
- Prerender
- Restore
10. Browser Cache
- Description: See how browser caching impacts your site performance.
- Options:
- DNS Unknown: If the domain name hasn't been visited before, the browser has to look it up in the DNS first. This setting shows events where the DNS lookup time is greater than zero.
- DNS Cached: The domain name is cached locally if the website was visited before within the domain's TTL (time-to-live cache setting). This setting shows events where the DNS lookup time is zero.
- Already Connected: If there's already an active connection to the web server, the next page can be loaded faster. This setting shows events where the connection time is zero.
- Content Cached: This setting shows page loads where the server time is zero, and the content is loaded by the browser cache.
11. Device Memory
- Description: Segment data by the amount of memory available on the user's device.
- Options:
- 256 MB
- 512 MB
- 1 GB
- 2 GB
- 4 GB
- Min. 8 GB
12. Network Type
- Description: Identify performance issues based on the network connection type.
- Options:
- Slow 2G
- 2G
- 3G
- 4G
13. Querystring Keys
- Description: Filter data based on URL querystring parameters.
- Use Case: Detect whether tracking variables like
utmare affecting initial page load times.
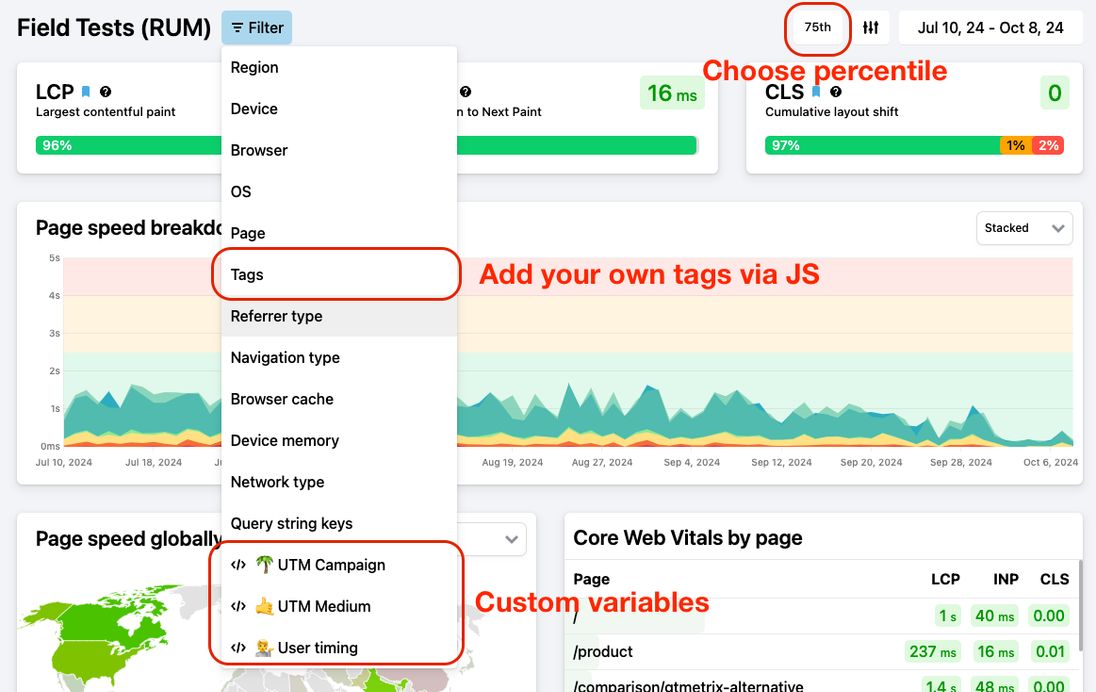
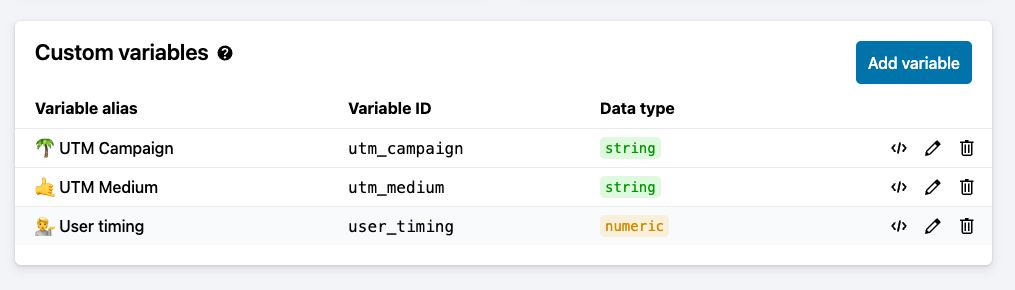
Custom Metrics & Variables
You can also add your own custom metrics and variables to the data. This is useful for tracking specific KPIs that are not included by default.
- Text Variables: Add any custom text-based data for segmentation or reporting.
- Numeric Variables: Add numerical data to track specific metrics (e.g., time spent on certain page features).
You can manage your custom variables under Settings > Field Tests (RUM)
Learn more about custom variables.
Percentile Options
PageVitals allows you to customize the percentile of data shown. By default, we show the 75th percentile (P75), but you can choose from several other percentiles depending on your needs:
- P25: 25th percentile (faster users).
- Median: 50th percentile (typical experience).
- P75: 75th percentile (default, slightly slower users).
- P90: 90th percentile (users experiencing higher latency).
- P95: 95th percentile (very slow experience).
- P99: 99th percentile (extreme outliers).
You can switch between these options to see how different segments of users are experiencing your site's performance.