Understanding Web Vitals in PageVitals
The Web Vitals overview is a powerful feature of PageVitals' Real User Monitoring (RUM) toolkit. It provides a comprehensive overview of your website's performance metrics, focusing on Core Web Vitals and other crucial performance metrics. You can get a quick overview of all metrics, and you can drill down to reports detailing each of them.
What are Core Web Vitals?
Core Web Vitals are a set of specific factors that Google considers important in a webpage's overall user experience. They are:
- Largest Contentful Paint (LCP): Shows how quickly the main content of a page loads
- Interaction to Next Paint (INP): Indicates how quickly your page responds to user interactions
- Cumulative Layout Shift (CLS): Measures how much unexpected layout shift occurs during page loading
Other notable metrics (a part of what we generally call Web Vitals) are Time To First Byte (TTFB) (time from request until the server starts responding), First Contentful Paint (FCP) (time before first visible item) and Blocking Scripts (LoAFs) which measure the total blocking time of the main thread (Long Animation Frames).
Core Web Vitals distribution
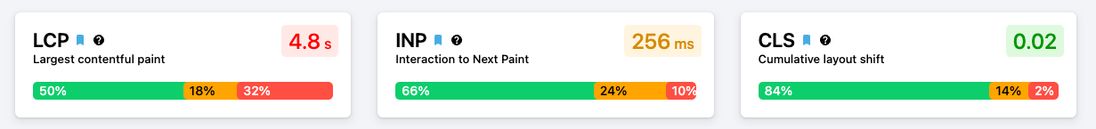
This section prominently displays the three Core Web Vitals:
- LCP: Shows how quickly the main content of a page loads
- INP: Indicates how quickly your page responds to user interactions
- CLS: Measures how much unexpected layout shift occurs during page loading
Each metric is presented with its current value (75th percentile by default), color-coded by green for good, yellow for needs improvement, red for poor. Under the metric the distribution is shown for how many users saw good, "needs improvement" and poor values. Google's recommendation is that 75% of the users or more should see good values.
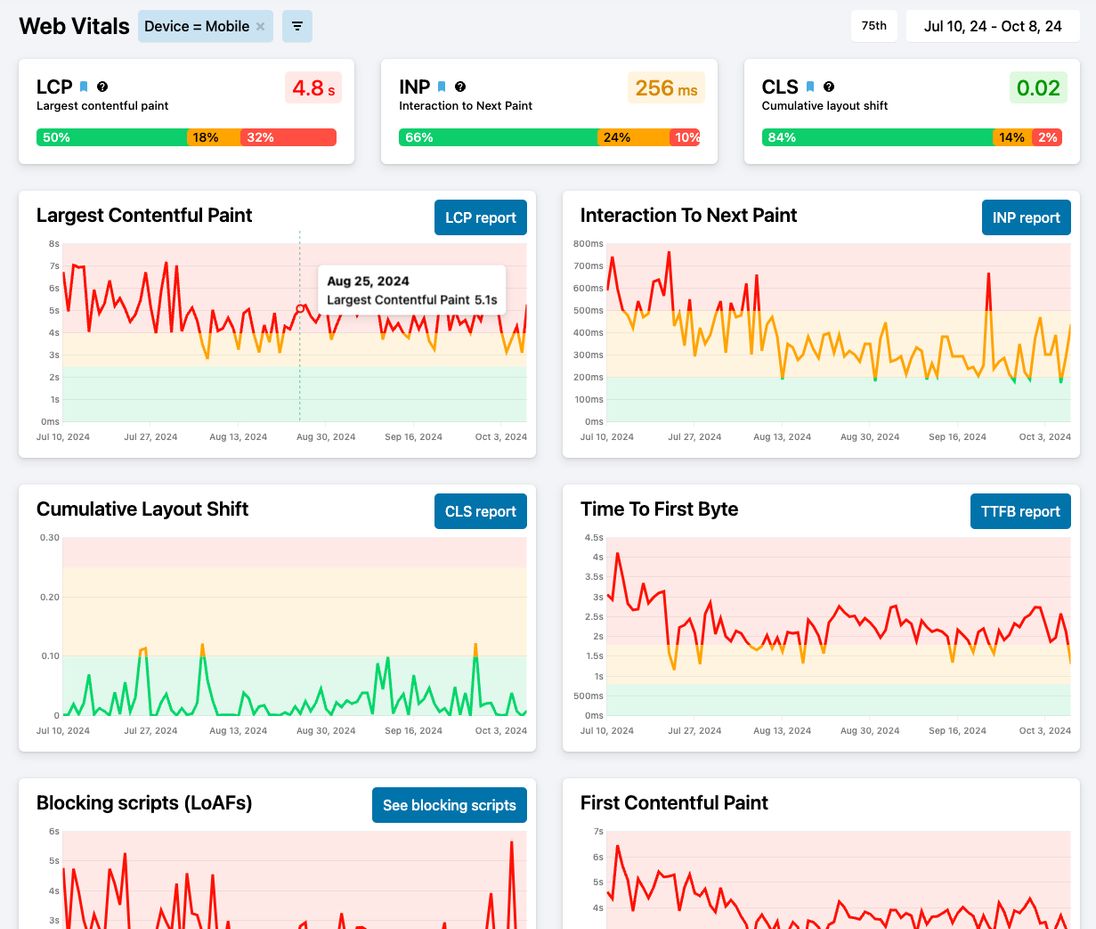
Interactive Charts
Below the Core Web Vitals, you'll find charts of all Web Vitals that visualizes the data over time. You can hover over data points for more detailed information, and you can filter by all imaginable filter types
Using the charts effectively
This page is a great starting points to get a quick overview of the development of all notable web vitals.
Monitor Trends: Regularly check the dashboard to spot any performance degradations over time.
Compare Segments: Use filters to compare performance across different user segments, devices, or geographical locations.
Drill Down: Click on any metric to access detailed reports for deeper analysis.
Detail reports
Learn more about the detail reports available from this page: