Understanding the Cumulative Layout Shift (CLS) report
The Cumulative Layout Shift (CLS) detail report is a valuable tool in PageVitals that provides in-depth insights into your website's layout stability. This article will guide you through the various components of this report and how to use them effectively to optimize your website's visual stability during loading.
Overview of the CLS detail report
The CLS detail report offers a comprehensive view of your website's CLS performance, broken down into several key components:
- Distribution chart
- Timeline chart
- Pages table
- Layout shifting elements table
Let's explore each of these components in detail.
1. Distribution chart
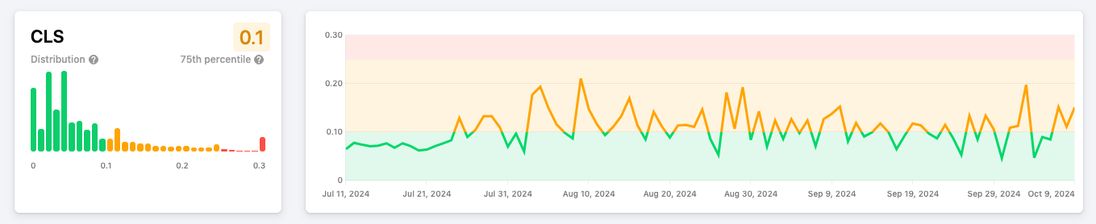
The distribution chart provides a visual representation of CLS values across your user base.
- Bars: Each bar represents a CLS range (e.g., 0.01-0.02) and shows the percentage of users experiencing CLS within that range.
- Percentile marker: A vertical line indicates the chosen percentile (e.g., p75), color-coded based on performance (green for good, yellow for needs improvement, red for poor).
How to use: This chart helps you understand the spread of CLS experiences across your users. A wide distribution might indicate inconsistent layout stability across different pages or user segments.
2. Timeline chart
Adjacent to the distribution chart, the timeline chart shows CLS trends over time.
- Color-coding: The chart is color-coded to quickly identify good (green), needs improvement (yellow), and poor (red) performance periods.
How to use: Look for patterns or sudden changes in CLS over time. This can help you correlate performance changes with deployments or other events.
3. Pages table
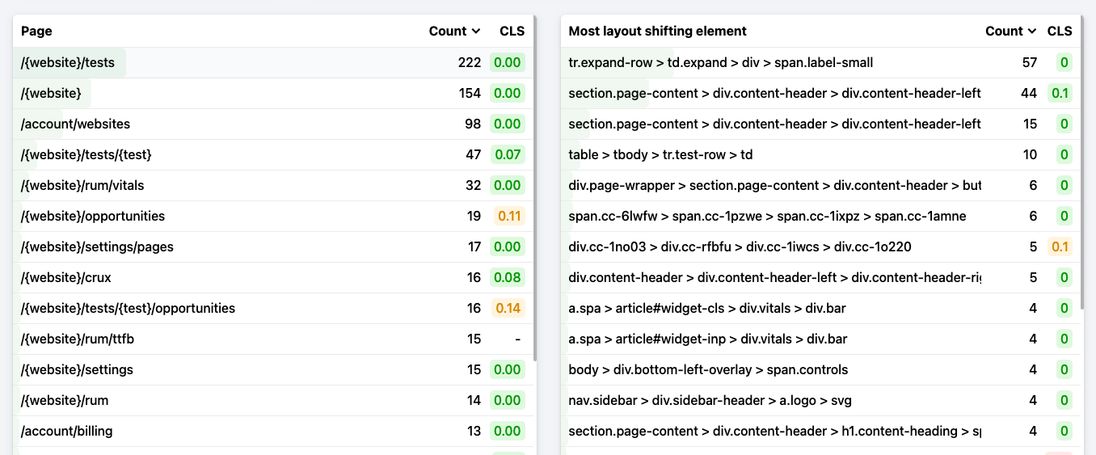
This table lists the pages visited on your site, along with their respective CLS metrics.
- Click-to-filter: Each row is clickable, allowing you to filter the entire report for that specific page.
How to use: Identify which pages have the best and worst CLS performance. Use the click-to-filter functionality to dive deeper into specific page performance.
4. Layout shifting elements table
This table lists the elements that are most commonly causing the largest layout shifts on your pages.
- CSS selectors: Each row shows the CSS selector for a layout shifting element.
- Count: The number of times this element caused the highest CLS on a pageview.
- CLS value: The average CLS value of the pageviews where the element had the largest CLS.
- Click-to-filter: You can click to filter the report for specific layout shifting elements.
How to use: Identify which elements are most commonly causing significant layout shifts on your site. This can guide your optimization efforts for specific UI elements.
Best practices for using the CLS detail report
Identify problem areas: Use the distribution and timeline charts to spot overall trends and issues.
Drill down into pages: Use the pages table to identify and focus on poorly performing pages.
Element-specific optimization: Use the layout shifting elements table to focus on optimizing the elements causing the most significant layout shifts.
Use filters wisely: Combine different filters (e.g., device type, browser, custom dimensions) to uncover segment-specific issues.
Regular monitoring: Check this report regularly, especially after major site changes or deployments.
Focus on the largest shifts: Remember that this report focuses on the largest CLS for each pageview, helping you prioritize the most impactful issues.
Correlate with user experience: High CLS values often correlate with poor user experience, so prioritize pages and elements with consistently high CLS.
Optimize for different devices: Use device-specific filters to ensure good CLS performance across various screen sizes and devices.
Tips for reducing CLS
Based on the insights from the CLS report, consider these strategies for improvement:
Specify size attributes for images and videos: This helps the browser allocate the correct amount of space while the element is loading.
Avoid inserting new content above existing content: Unless in response to a user interaction, this can cause unexpected layout shifts.
Use transform animations: Instead of animations that trigger layout changes, use transform animations for smoother transitions.
Optimize web font loading: Use
font-display: optionalorfont-display: swapto prevent text from shifting after it loads.Minimize dynamic content: Be cautious with dynamically injected content, especially ads or banners that can cause layout shifts.
Reserve space for dynamic elements: If you must use dynamic elements, reserve space for them in advance to prevent layout shifts.
Conclusion
The CLS detail report in PageVitals is a powerful tool for understanding and optimizing your website's layout stability. By regularly analyzing this data and acting on the insights, you can significantly improve your users' experience and potentially boost your search engine rankings. Remember, optimizing CLS is an ongoing process, and this report is your guide to continual improvement in maintaining a visually stable and user-friendly website.