Understanding the Interaction to Next Paint (INP) report
The Interaction to Next Paint (INP) Detail Report is a powerful tool in PageVitals that provides in-depth insights into your website's INP performance. This article will guide you through the various components of this report and how to use them effectively to optimize your website's interactivity.
Overview of the INP detail report
The INP Detail Report offers a comprehensive view of your website's INP performance, broken down into several key components:
- Distribution Chart
- Timeline Chart
- Pages Table
- INP Phase Breakdown
- Clicked Page Element Table
- Device Memory Table
- Blocking Script Table
- Script Invoker Table
Let's explore each of these components in detail.
1. Distribution chart
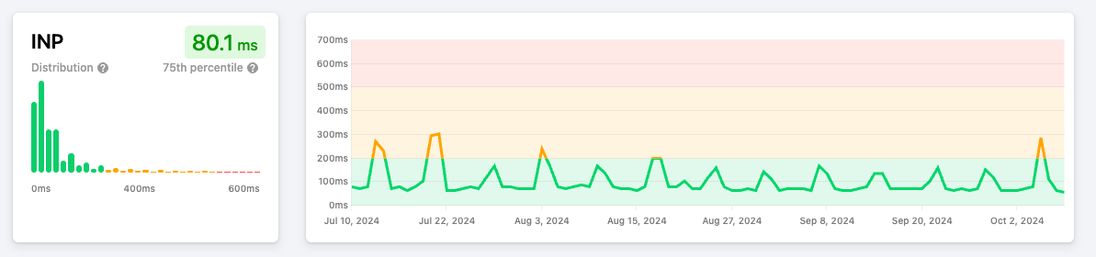
The Distribution Chart provides a visual representation of INP values across your user base.
- Bars: Each bar represents a time range (e.g., 50-100ms) and shows the percentage of users experiencing INP within that range.
- Percentile Marker: A vertical line indicates the chosen percentile (e.g., p75), color-coded based on performance (green for good, yellow for needs improvement, red for poor).
How to use: This chart helps you understand the spread of INP experiences across your users. A wide distribution might indicate inconsistent performance across different user segments or devices.
2. Timeline chart
Adjacent to the Distribution Chart, the Timeline Chart shows INP trends over time.
- Color-coding: The chart is color-coded to quickly identify good (green), needs improvement (yellow), and poor (red) performance periods.
How to use: Look for patterns or sudden changes in INP over time. This can help you correlate performance changes with deployments or other events.
3. Pages table
This table lists the pages visited on your site, along with their respective INP metrics.
- Click-to-Filter: Each row is clickable, allowing you to filter the entire report for that specific page.
How to use: Identify which pages have the best and worst INP performance. Use the click-to-filter functionality to dive deeper into specific page performance.
4. INP phase breakdown
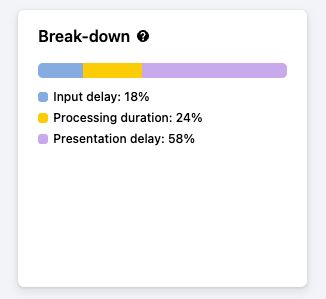
This crucial section breaks down the INP into its constituent phases:
- Input Delay: Time from the user's interaction until the event handler is run
- Processing Duration: Time taken to run the event handlers
- Presentation Delay: Time after processing the handler until the browser shows (or is able to show) a visual response
How to use: This breakdown helps you pinpoint which phase of the INP process needs optimization. For example, a high Input Delay might indicate main thread blocking, while a long Processing Duration could suggest inefficient event handlers.
5. Clicked Page Element table
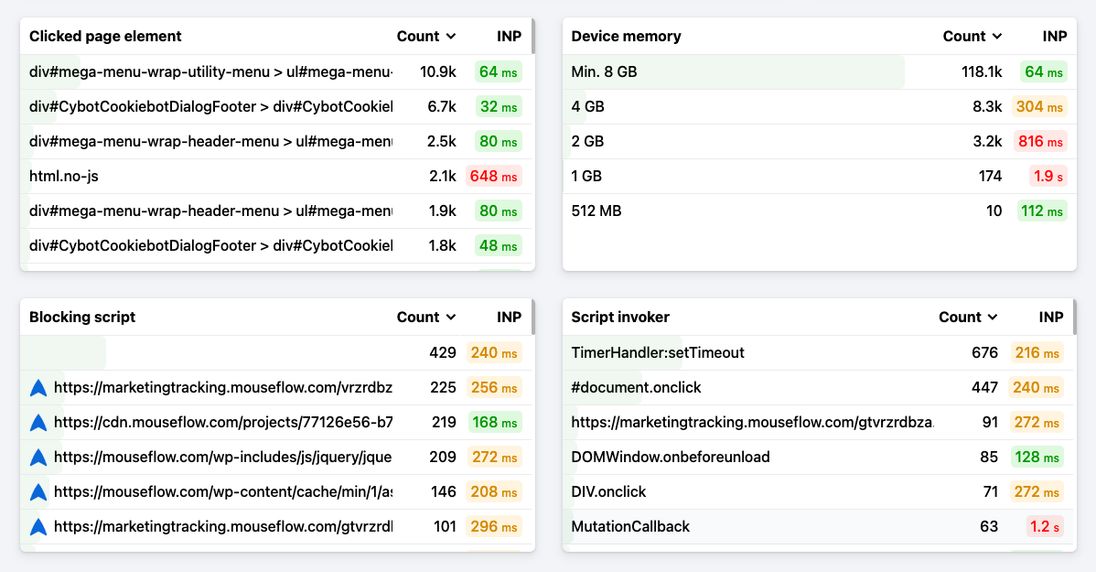
This table lists the elements that are most commonly interacted with on your pages.
- CSS Selectors: Each row shows the CSS selector for an interacted element.
- Count: The number of pageviews where this element gave the highest INP time.
- INP Value: The average INP time for all the pageviews where the element had the highest INP time.
- Click-to-Filter: You can click to filter the report for specific interacted elements.
How to use: Identify which elements are most commonly interacted with on your site and their INP performance. This can guide your optimization efforts for specific UI elements.
6. Device Memory table
This table shows INP performance across different device memory capacities.
- Memory Ranges: Each row represents a range of device memory (e.g., 0-2GB, 2-4GB).
- INP Value: The average INP time for devices in each memory range.
- Click-to-Filter: You can filter the report for specific memory ranges.
How to use: Understand how device memory affects INP performance. This can help in optimizing for low-end devices or identifying memory-related issues.
7. Blocking Script table
This table lists scripts that are blocking the main thread and potentially causing high INP.
- Script URL: The URL of the blocking script.
- Count: The number of times this script caused the highest INP in the pageview.
- INP Value: The average INP time when this script was causing the highest INP.
- Click-to-Filter: You can filter the report for specific blocking scripts.
How to use: Identify problematic scripts that are causing high INP. This can guide your efforts in script optimization or asynchronous loading.
8. Script Invoker table
This table shows what invoked the scripts that led to high INP.
- Invoker: The entity that called the script (e.g., setTimeout, onclick handler, a specific script URL).
- Count: The number of times this invoker led to the highest INP.
- INP Value: The average INP time associated with this invoker.
- Click-to-Filter: You can filter the report for specific script invokers.
How to use: Understand the root causes of high INP by identifying which script invocations are problematic. This can help in optimizing event handlers or adjusting how scripts are called.
Best practices for using the INP detail report
Identify problem areas: Use the Distribution and Timeline charts to spot overall trends and issues.
Drill down into pages: Use the Pages table to identify and focus on poorly performing pages.
Optimize INP Phases: Use the INP Phase Breakdown to target specific areas for improvement:
- High Input Delay? Look into reducing main thread blocking.
- Long Processing Duration? Optimize your event handlers.
- High Presentation Delay? Check for complex layout changes or repaints.
Element-specific optimization: Use the Clicked Page Element table to focus on optimizing the most commonly interacted elements.
Device-Aware Optimization: Use the Device Memory table to ensure good performance across different device capabilities.
Script Optimization: Use the Blocking Script and Script Invoker tables to identify and optimize problematic scripts and their invocation methods.
Use Filters Wisely: Combine different filters (e.g., device type, browser, custom dimensions) to uncover segment-specific issues.
Regular Monitoring: Check this report regularly, especially after major site changes or deployments.
Conclusion
The INP Detail Report in PageVitals is a powerful tool for understanding and optimizing your website's interactivity performance. By regularly analyzing this data and acting on the insights, you can significantly improve your users' experience and potentially boost your search engine rankings. Remember, optimizing INP is an ongoing process, and this report is your guide to continual improvement.