Understanding the Largest Contentful Paint (LCP) Detail Report
The Largest Contentful Paint (LCP) Detail Report is a powerful tool in PageVitals that provides in-depth insights into your website's LCP performance. This article will guide you through the various components of this report and how to use them effectively to optimize your website's loading experience.
Overview of the LCP Detail Report
The LCP Detail Report offers a comprehensive view of your website's LCP performance, broken down into several key components:
- Distribution Chart
- Timeline Chart
- Pages Table
- LCP Phase Breakdown
- World Map
- LCP Elements Table
Let's explore each of these components in detail.
1. Distribution Chart
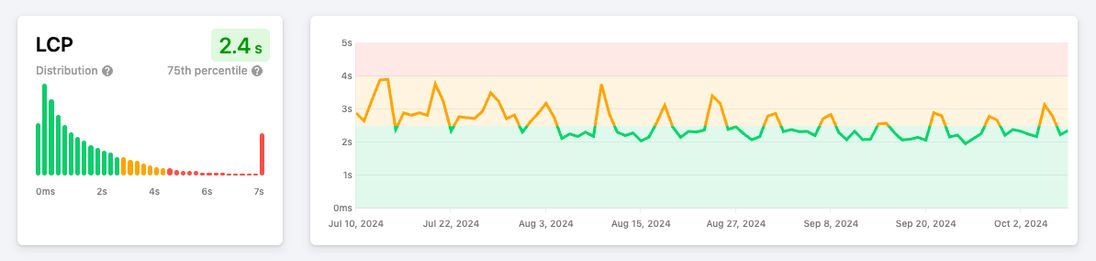
The Distribution Chart provides a visual representation of LCP values across your user base.
- Bars: Each bar represents a time range (e.g., 200-400ms) and shows the percentage of users experiencing LCP within that range.
- Percentile Marker: A vertical line indicates the chosen percentile (e.g., p75), color-coded based on performance (green for good, yellow for needs improvement, red for poor).
How to use: This chart helps you understand the spread of LCP experiences across your users. A wide distribution might indicate inconsistent performance across different user segments.
2. Timeline Chart
Adjacent to the Distribution Chart, the Timeline Chart shows LCP trends over time.
- Color-coding: The chart is color-coded to quickly identify good (green), needs improvement (yellow), and poor (red) performance periods.
How to use: Look for patterns or sudden changes in LCP over time. This can help you correlate performance changes with deployments or other events.
3. Pages Table
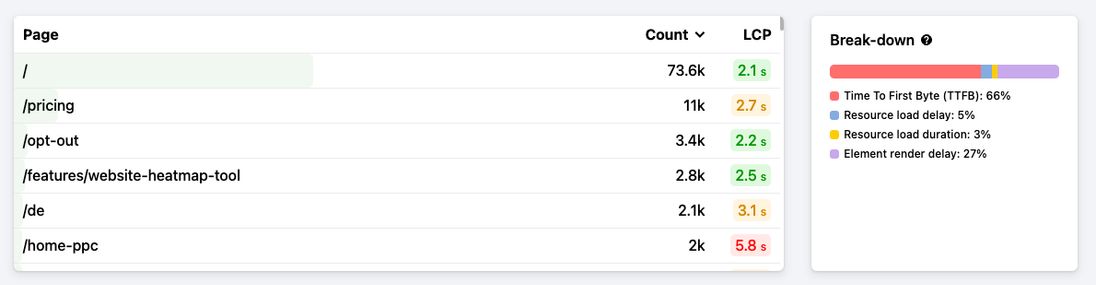
This table lists the pages visited on your site, along with their respective LCP metrics.
- Click-to-Filter: Each row is clickable, allowing you to filter the entire report for that specific page.
How to use: Identify which pages have the best and worst LCP performance. Use the click-to-filter functionality to dive deeper into specific page performance.
4. LCP Phase Breakdown
This crucial section breaks down the LCP into its constituent phases:
- Time to First Byte (TTFB): Server response time
- Resource Load Delay: Time from TTFB to the start of LCP resource loading
- Resource Load Duration: Time taken to load the LCP resource
- Element Render Delay: Time from resource load completion to visibility on screen
How to use: This breakdown helps you pinpoint which phase of the LCP process needs optimization. For example, a high TTFB might indicate server-side issues, while a long Resource Load Duration could suggest optimization opportunities for the LCP element itself.
5. World Map
The World Map visualizes LCP performance across different geographical locations.
- Color-coding: Countries are color-coded based on their average LCP performance.
- Zoom and Click: You can zoom into specific regions and click on countries to filter the report data.
How to use: Identify performance discrepancies across different regions. This can help in decisions about CDN usage or server locations.
6. LCP Elements Table
This table lists the elements that are most commonly the LCP for your pages.
- CSS Selectors: Each row shows the CSS selector for an LCP element.
- Count: The number of times this element was the LCP.
- LCP Value: The average LCP time for this element.
- Click-to-Filter: Like the Pages Table, you can click to filter the report for specific LCP elements.
How to use: Identify which elements are most commonly the LCP on your site. This can guide your optimization efforts.
Best Practices for Using the LCP Detail Report
Identify Problem Areas: Use the Distribution and Timeline charts to spot overall trends and issues.
Drill Down into Pages: Use the Pages Table to identify and focus on poorly performing pages.
Optimize LCP Phases: Use the LCP Phase Breakdown to target specific areas for improvement:
- High TTFB? Look into server optimization or CDN usage.
- Long Resource Load Duration? Optimize your LCP images or elements.
- High Element Render Delay? Check for render-blocking resources.
Geographical Optimization: Use the World Map to identify regions that might benefit from CDN implementation or server relocation.
Element-Specific Optimization: Use the LCP Elements Table to focus on optimizing the most common LCP elements.
Uncover Hidden Issues: Look for unexpected LCP elements, such as:
- Cookie consent boxes being the LCP on mobile devices.
- Large, lazy-loaded images unexpectedly becoming the LCP.
Use Filters Wisely: Combine different filters (e.g., device type, browser, custom dimensions) to uncover segment-specific issues.
Regular Monitoring: Check this report regularly, especially after major site changes or deployments.
Conclusion
The LCP Detail Report in PageVitals is a powerful tool for understanding and optimizing your website's loading performance. By regularly analyzing this data and acting on the insights, you can significantly improve your users' experience and potentially boost your search engine rankings. Remember, optimizing LCP is an ongoing process, and this report is your guide to continual improvement.