Understanding the Time to First Byte (TTFB) report
The Time to First Byte (TTFB) detail report is a crucial tool in PageVitals that provides comprehensive insights into your website's initial response time. This article will guide you through the various components of this report and how to use them effectively to optimize your website's TTFB performance.
Overview of the TTFB detail report
The TTFB detail report offers a detailed view of your website's TTFB performance, broken down into several key components:
- Distribution chart
- Timeline chart
- Pages table
- TTFB breakdown
- World map
- Navigation type table
- Querystring key table
- Referrer type table
Let's explore each of these components in detail.
1. Distribution chart
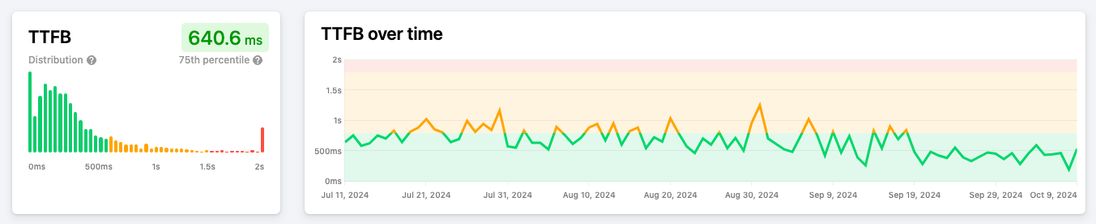
The distribution chart provides a visual representation of TTFB values across your user base.
- Bars: Each bar represents a time range (e.g., 100-200ms) and shows the percentage of users experiencing TTFB within that range.
- Percentile marker: A vertical line indicates the chosen percentile (e.g., p75), color-coded based on performance (green for good, yellow for needs improvement, red for poor).
How to use: This chart helps you understand the spread of TTFB experiences across your users. A wide distribution might indicate inconsistent performance across different user segments or geographical locations.
2. Timeline chart
Adjacent to the distribution chart, the timeline chart shows TTFB trends over time.
- Color-coding: The chart is color-coded to quickly identify good (green), needs improvement (yellow), and poor (red) performance periods.
How to use: Look for patterns or sudden changes in TTFB over time. This can help you correlate performance changes with deployments or other events.
3. Pages table
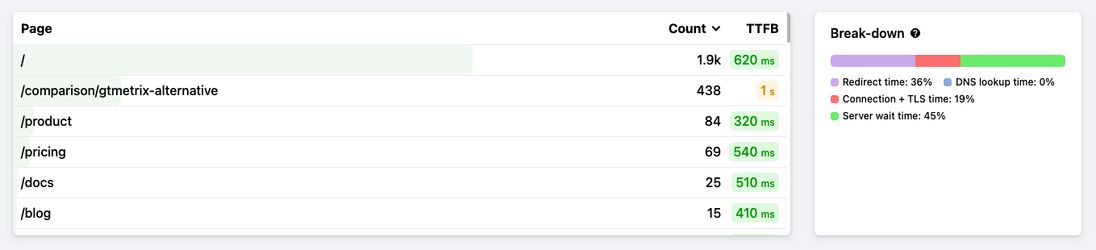
This table lists the pages visited on your site, along with their respective TTFB metrics.
- Click-to-filter: Each row is clickable, allowing you to filter the entire report for that specific page.
How to use: Identify which pages have the best and worst TTFB performance. Use the click-to-filter functionality to dive deeper into specific page performance.
4. TTFB breakdown
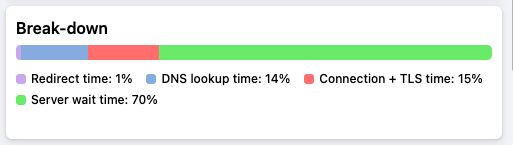
This crucial section breaks down the TTFB into its constituent phases:
- Redirect time: Time spent following HTTP redirects.
- DNS lookup time: Time taken to resolve the domain name to an IP address.
- Connection/TLS time: Time taken to establish a TCP connection and complete the TLS handshake (for HTTPS).
- Server wait time: Time from when the request is sent until the first byte of the response is received. This includes server processing time and network latency.
How to use: This breakdown helps you pinpoint which phase of the TTFB process needs optimization. For example, high DNS lookup times might indicate DNS provider issues, while long server wait times could suggest server-side performance problems.
5. World map

The world map visualizes TTFB performance across different geographical locations.
- Color-coding: Countries are color-coded based on their average TTFB performance.
- Zoom and click: You can zoom into specific regions and click on countries to filter the report data.
How to use: Identify performance discrepancies across different regions. This can help in decisions about CDN usage or server locations.
6. Navigation type table
This table shows TTFB performance across different navigation types.
- Navigation types: Includes navigation, back/forward, reload, prerender, etc.
- Count: The number of pageviews for each navigation type.
- TTFB: The average TTFB for each navigation type.
- Click-to-filter: You can filter the report for specific navigation types.
How to use: Understand how TTFB varies across different navigation scenarios. This can help in optimizing for specific user flows.
7. Querystring key table
This table lists the querystring keys used in URLs and their impact on TTFB.
- Querystring keys: Common keys like gclid, utm variables, etc.
- Count: The number of pageviews with each querystring key.
- TTFB: The average TTFB for pageviews with each querystring key.
- Click-to-filter: You can filter the report for specific querystring keys.
How to use: Identify querystring keys that might be causing cache bypasses, leading to slower TTFB. This can guide optimization of caching strategies.
8. Referrer type table
This table shows TTFB performance across different referrer types.
- Referrer types: Includes none, internal link, external link.
- Count: The number of pageviews for each referrer type.
- TTFB: The average TTFB for each referrer type.
- Click-to-filter: You can filter the report for specific referrer types.
How to use: Understand how TTFB varies based on how users arrive at your pages. This can help in optimizing for different traffic sources.
Best practices for using the TTFB detail report
Identify problem areas: Use the distribution and timeline charts to spot overall trends and issues.
Drill down into pages: Use the pages table to identify and focus on poorly performing pages.
Optimize TTFB phases: Use the TTFB breakdown to target specific areas for improvement.
Geographical optimization: Use the world map to identify regions that might benefit from CDN implementation or server relocation.
Navigation optimization: Use the navigation type table to optimize for different user flows.
Caching strategy: Use the querystring key table to refine your caching strategy and avoid unnecessary cache bypasses.
Traffic source optimization: Use the referrer type table to optimize for different traffic sources.
Use filters wisely: Combine different filters (e.g., device type, browser, custom dimensions) to uncover segment-specific issues.
Conclusion
The TTFB detail report in PageVitals is a powerful tool for understanding and optimizing your website's initial response time. By regularly analyzing this data and acting on the insights, you can significantly improve your users' experience and potentially boost your search engine rankings. Remember, optimizing TTFB is an ongoing process, and this report is your guide to continual improvement in delivering fast and responsive web experiences.