Lighthouse tests
The first feature you'll use when starting out with PageVitals are Lighthouse tests. Let's talk about what Lighthouse is and how to interpret the results from a Lighthouse test.
Note that we've covered the basic in this article about reading your first test
First - a word about Puppeteer
Before going into detail with Lighthouse, we need to explain how we run them. When running tests, either manually triggered or scheduled, we fire up a so-called headless browser (Puppeteer) in our cloud platform. We configure that browser to simulate either a desktop browser, or a mobile browser.
Note that the mobile browser is really just an artificial limit on the CPU and network speed, as well as a smaller viewport. This is important to understand when interpreting mobile results.
When the Puppeteer browser is up and running, we run the Lighthouse report. You can actually do the same in your own Chrome browser. Simply open Developer Tools (hit F12 or right-click + "Inspect"), find the "Lighthouse" tab, and hit "Analyze page load".
Test queueing and execution order
When a test series is triggered, either manually in the UI or by our scheduler, a desktop and a mobile test of each of your pages are put in a test queue. A number of test agents are immediately spun up and start executing tests in a sand-boxed environment. There's no way to control the order in which the tests are carried out.
Reading the results

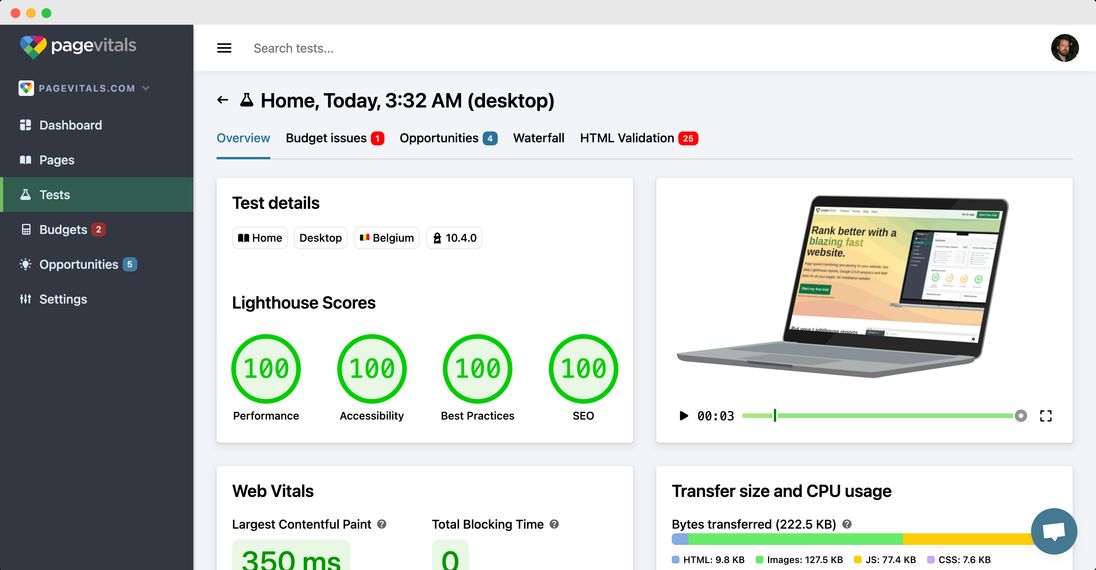
A lighthouse report can be broken down into the following:
- 4 performance scores (Performance, Accessibility, Best Practices and SEO)
- A lot of metrics (Largest Contentful Paint, Total Blocking Time, Speed Index, etc.)
- A list of opportunities (each of which belongs to one of the four mentioned categories)
- A screenshot of the final browser viewport, a screenshot of the full-length page, and a list of screens showing how the page looked when it loaded.
At PageVitals we've altered the way item 4 (screenshots) work. First of all we've increased the resolution of the screenshots so they're easier and nicer to watch. Secondly, we've built out the list of screens showing loading progress because we want to be able to show the loading progress as a real hi-fidelity video instead of small and too few images that are included by default.
Finally, but not a part of Lighthouse, we include a full network request list ("waterfall view") with each test. This is similar to what you can see in the "Network" tab in the Chrome Developer Tools. You can read more about the Network Request Waterfall here
You can read a lot more about Lighthouse here