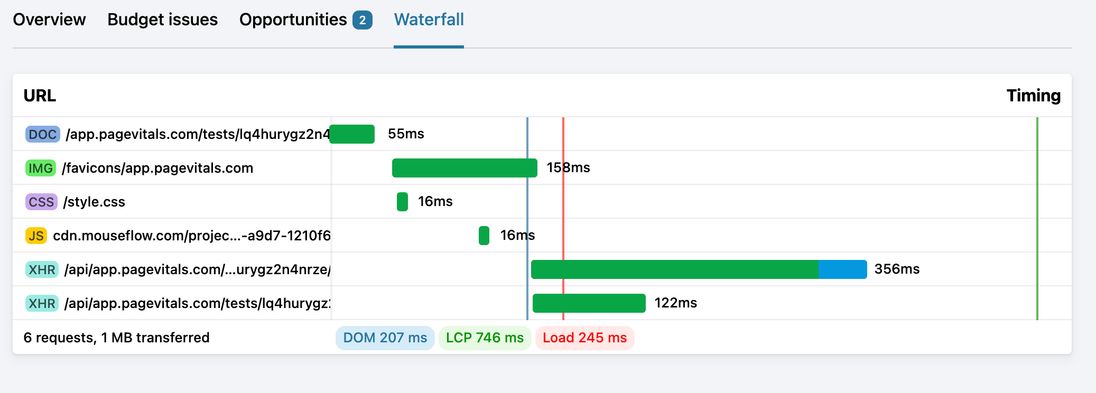
Network request waterfall
Each Lighthouse test comes with a tab called Waterfall. Let's take a closer look at that.
The waterfall report

This report shows you every single network call that was being made during the loading of the given page. Each request has a tag showing the category (HTML, image, CSS, JS, etc.), and a timeline bar showing the following timing components:
- When the request was initiated
- How long the request was blocked by the browser (grey)
- How long it took to resolve the DNS (purple)
- How long it took to connect to the server (yellow)
- How long it took to establish a TLS connection (magenta)
- How long the server took before sending the first byte (green)
- How long it took to transfer the whole response (blue)
If you hover the requested resource, you'll see the full URL. If you click, you'll expand the request to see every single HTTP header - both request and response headers.
Page timing components
The reports shows three vertical lines that represents three different overall page timing components:
- DOM ready (blue). Shows when the HTML structure of the page was parsed and ready.
- LCP (green). Shows the Largest Contentful Paint event.
- Load (red). Shows when the page was fully loaded.
Download HAR file
If you want, you can even download the whole waterfall report as an HTTP Archive file (.har). To show the contents visually, simply drag and drop the file into Chrome Developer Tool under the "Network" tab.