Table of contents
Chrome user experience report (CrUX)
A 10% conversion lift from performance work is hard to prove if you can't show that real customers actually experienced the speedup. CrUX is one of the few datasets that lets you answer that credibly – because it's built from what Chrome users saw in the wild, not from a lab test you ran once.
Chrome User Experience Report (CrUX) is Google's public dataset of real-user (field) performance metrics collected from opted-in Chrome users, aggregated and anonymized, and reported as distributions and percentiles over a rolling 28-day window for URLs and entire origins.
If you're already watching Core Web Vitals, CrUX is a major source behind the "field data" you see in many reports – including the field section of PageSpeed Insights.
What CrUX reveals about your site
CrUX is most useful when you treat it like a decision tool, not a score:
- It tells you what users actually experienced, across real devices, networks, geographies, and user behavior.
- It highlights tail pain (the slowest ~25% of visits), which is often where revenue and SEO losses hide.
- It keeps you honest: if your lab tests look great but CrUX is poor, real customers are still struggling.
CrUX also forces a helpful question: are you optimizing the pages customers use, under the conditions they have?
The Website Owner's perspective
CrUX is how you validate that performance work is showing up for real customers – especially on mobile. It's also how you catch "silent regressions" that didn't show up in a single lab run but hurt a meaningful slice of traffic (and therefore sales).
How CrUX is calculated (without the mystery)
CrUX is aggregated field telemetry. At a practical level, three concepts matter:
Rolling 28-day window
CrUX is not "today's performance." Each day, Google publishes an updated view of the last 28 days. That smooths noise but creates a built-in delay between shipping a change and seeing CrUX fully reflect it.Distributions (good / needs improvement / poor)
For each metric, CrUX reports how many user experiences fell into three buckets. This is crucial: you can improve the average while still leaving too many users in the "poor" bucket.Percentiles (especially the 75th percentile)
For Core Web Vitals evaluation, Google uses the 75th percentile (p75). That means your "pass" depends on what the slower end of your user population experiences – not your best-case runs.
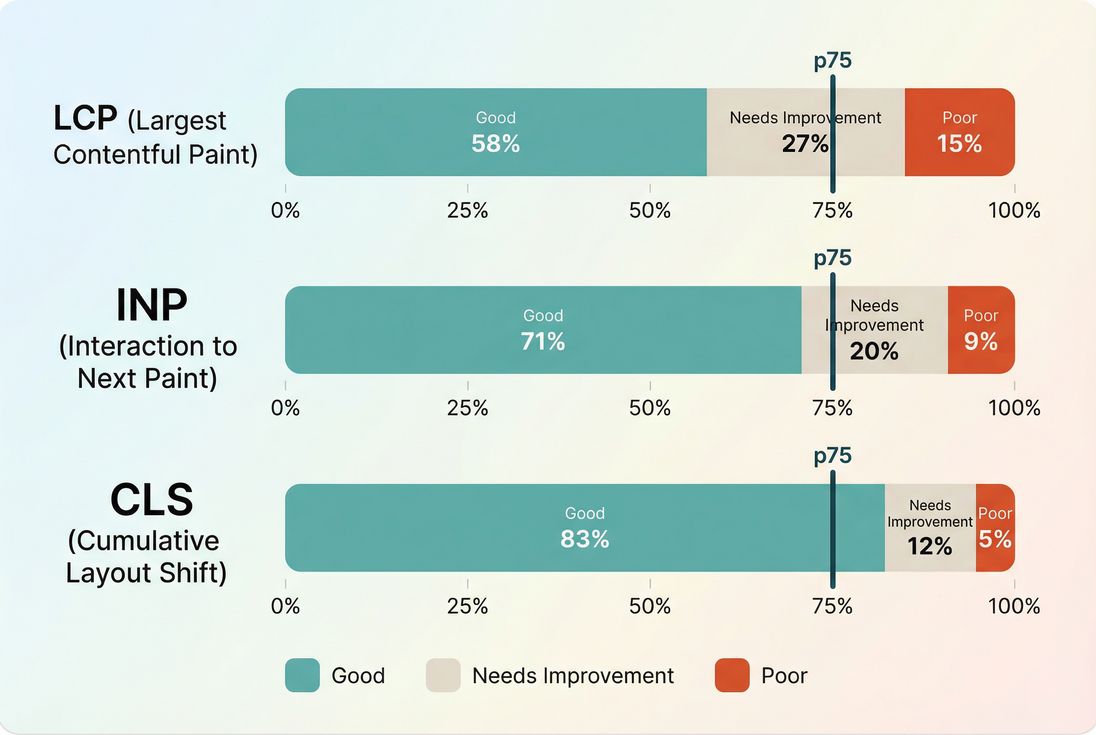
*CrUX is best read as a distribution plus a p75 checkpoint – because moving users out of "poor" often matters more than tiny improvements for already-fast visits.*
What metrics does CrUX include?
CrUX contains multiple user-experience metrics, but for most businesses the "money metrics" are the Core Web Vitals:
- Largest Contentful Paint (LCP) (loading experience)
- Interaction to Next Paint (INP) (interactivity responsiveness)
- Cumulative Layout Shift (CLS) (visual stability)
CrUX also commonly reports metrics like First Contentful Paint (FCP) and sometimes other diagnostics depending on the surface you're using.
The thresholds you should internalize
These are the standard Core Web Vitals thresholds used in CrUX reporting:
| Metric | Good | Needs improvement | Poor |
|---|---|---|---|
| LCP | ≤ 2.5s | 2.5s–4.0s | > 4.0s |
| INP | ≤ 200ms | 200ms–500ms | > 500ms |
| CLS | ≤ 0.1 | 0.1–0.25 | > 0.25 |
Where CrUX helps (and where it doesn't)
CrUX is powerful, but only if you understand its blind spots.
When CrUX is the right tool
Use CrUX when you need to:
- Report real-world impact to leadership (especially SEO + revenue teams)
- Benchmark your origin against competitors or industry peers
- Track regressions that show up only in real conditions
- Prioritize page templates that hurt the most users
When CrUX can mislead you
It's delayed by design
Because of the rolling window, you won't see an overnight jump after deploying a fix. You'll see a slope.It's traffic-mix sensitive
A marketing campaign can "worsen" CrUX by bringing:- more mobile users (see Mobile page speed)
- more users from slower regions
- more first-time visitors (cold cache)
- more sessions on slower landing pages
It may not exist at URL level
Smaller sites or low-traffic pages often have:- no URL-level CrUX
- only origin-level CrUX
- gaps for new pages until volume accumulates
It's not a debugging tool
CrUX tells you that users are slow, not why. For diagnosis, you pair it with lab tooling and workflow understanding like the critical rendering path and field vs lab data.
The Website Owner's perspective
If CrUX gets worse right after a "successful" release, don't assume engineering failed. First ask: did we change who is visiting (traffic mix), what they're landing on (page mix), or where they're served from (CDN/origin)? CrUX is an outcome metric; it reflects operations and marketing too.
How to interpret CrUX changes over time
Most misreads happen because teams treat CrUX like a daily KPI. It's better treated like a trend + distribution shift.
Expect gradual movement after a release
A helpful mental model:
- Day 0: you ship improvements; lab tests improve immediately
- Days 1–7: CrUX may barely move (most of the 28-day window is still "old")
- Days 7–28: CrUX should trend toward the new reality
- After 28 days: CrUX should largely reflect the post-change experience
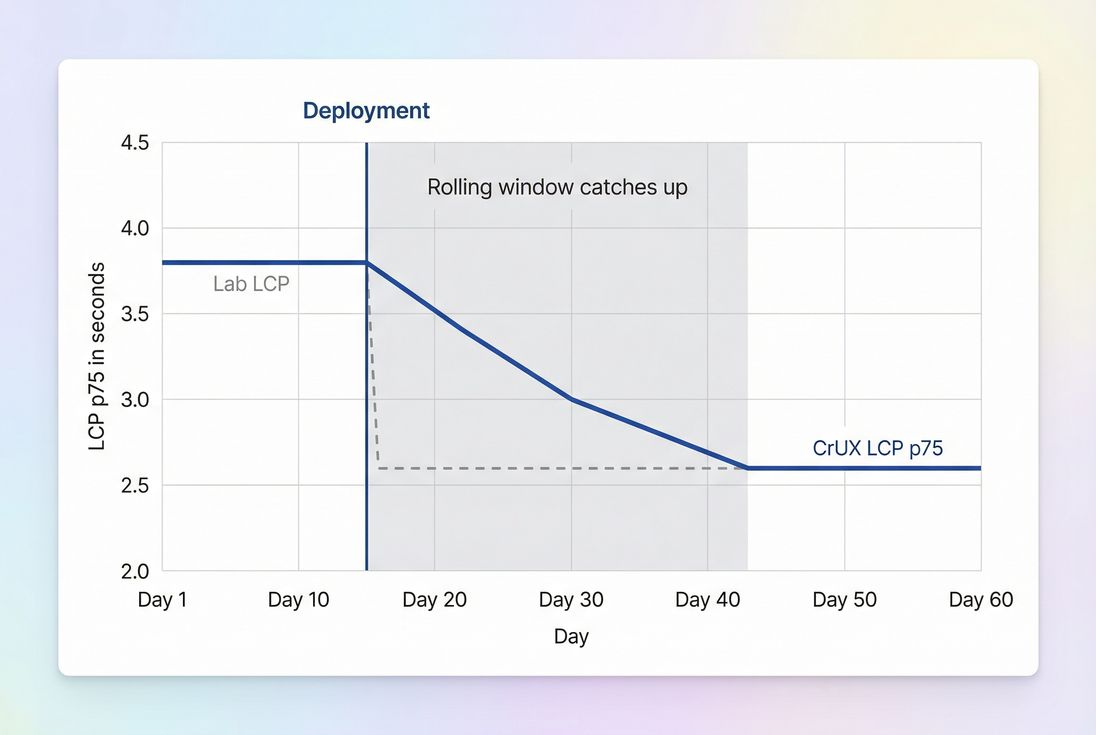
*Because CrUX is a rolling 28-day view, real improvements show up as a slope – not an instant jump. Plan reporting timelines accordingly.*
Watch the "poor" bucket, not only p75
Two very common scenarios:
- p75 improves but revenue doesn't: you improved borderline users, but the worst-off users (often mobile on slow networks) are still stuck in "poor."
- p75 stays the same but support complaints drop: you reduced the "poor" bucket meaningfully, but not enough to move the percentile threshold yet.
This is why distributions matter in addition to the percentile pass/fail.
Tie changes to operational realities
If CrUX worsens, ask these questions before you panic:
- Did TTFB rise (origin slowdown, cache misses, database load)?
- Did you ship new third parties (see Third-party scripts)?
- Did JavaScript main-thread work increase (see Reduce main thread work and JavaScript execution time)?
- Did you change caching behavior (Browser caching, Cache-Control headers, Effective cache TTL)?
- Did you change how above-the-fold content loads (Above-the-fold optimization, Critical CSS)?
How website owners use CrUX to prioritize work
CrUX becomes actionable when you stop looking only at "the site" and start looking at page groups.
Use origin-level for strategy, URL-level for targeting
- Origin-level CrUX is best for: executive reporting, SEO health checks, competitive benchmarks.
- URL-level CrUX is best for: identifying a specific template (PDP, PLP, blog article) that's hurting users.
If URL-level isn't available, you can still work effectively by grouping pages in your own analytics and testing representative templates with lab tools.
A practical prioritization workflow
Find your worst user experiences
- Is the biggest problem LCP, INP, or CLS?
- Is the "poor" bucket high, or is the p75 barely missing?
Map the pain to page types
- Home page vs category vs product vs checkout
- Logged-out vs logged-in
- Marketing landing pages vs SEO blog pages
Pick fixes that move real-user outcomes
- If LCP is failing: focus on server + render path + hero media
Common levers: TTFB, CDN performance, Image optimization, Responsive images, Font loading, Render-blocking resources - If INP is failing: focus on JavaScript work and long tasks
Common levers: Long tasks, Unused JavaScript, Code splitting, Async vs defer - If CLS is failing: focus on layout stability
Common levers: Layout instability, Zero layout shift, font and image dimension hygiene
- If LCP is failing: focus on server + render path + hero media
Validate fast, then confirm in CrUX
- Validate in synthetic tests (repeatable).
- Confirm in CrUX as the 28-day window updates.
The Website Owner's perspective
This workflow protects you from "optimizing the wrong thing." If CrUX says your checkout is fine but your product pages are failing LCP on mobile, your highest-ROI work is likely image delivery, caching, and render-path cleanup on PDPs – not micro-optimizations in checkout.
Where to access CrUX (and what to use it for)
You'll typically encounter CrUX through these surfaces:
- PageSpeed Insights (quick checks; mixes lab + field context): PageSpeed Insights
- Google Search Console Core Web Vitals (SEO-focused aggregation)
- CrUX API / BigQuery dataset (for analysts, dashboards, and segmentation)
If you're using PageVitals, the product's CrUX visualization is documented here: Chrome UX Report. (This is most helpful when you want trend history and a clean view of distributions without building your own pipeline.)
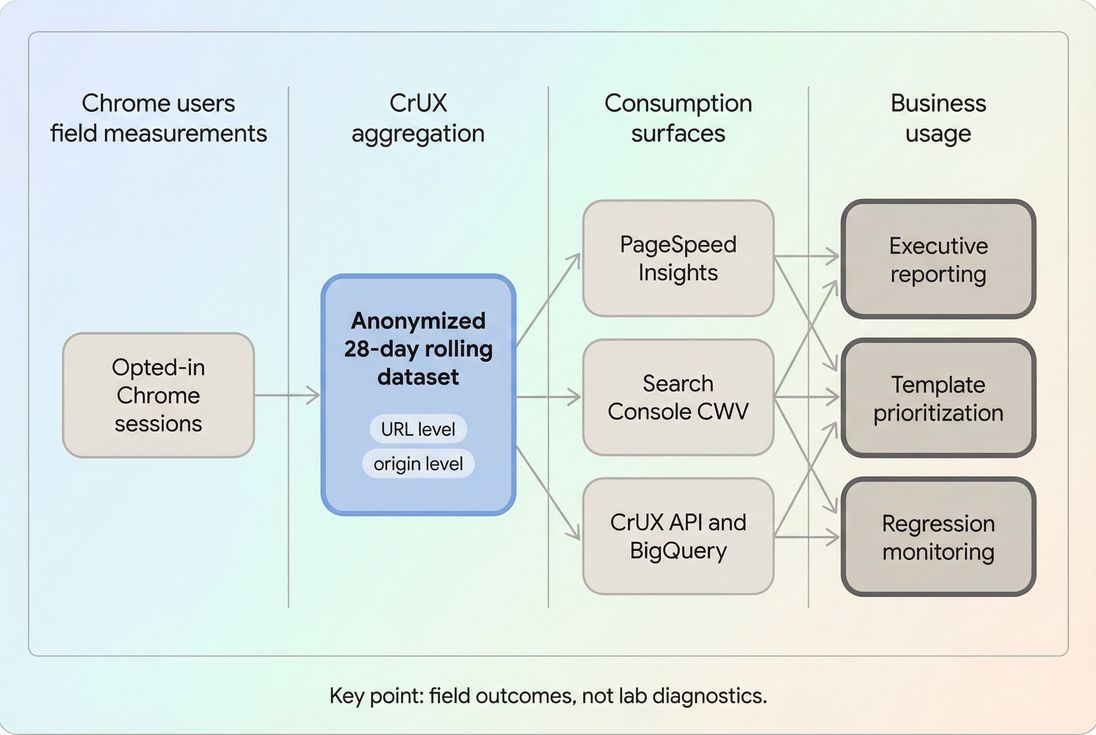
*CrUX is a shared field-data backbone: multiple tools display it, but you still need lab diagnostics to learn what to fix.*
Common CrUX decision pitfalls (and how to avoid them)
Pitfall 1: "We passed CWV, we're done"
Passing is not the same as being fast enough to win. If competitors are materially faster, you may still be leaving conversion rate on the table. Use CrUX for benchmarking, then set internal targets (see Performance budgets).
Pitfall 2: Chasing a single number
CrUX's percentile is useful, but distribution shift is often more operationally meaningful. A release that reduces the poor bucket from 22% to 12% can be a huge customer experience win even if p75 barely moves at first.
Pitfall 3: Ignoring infrastructure causes
Real-user slowdowns frequently trace back to:
- caching gaps (Edge caching, CDN vs origin latency)
- compression misconfiguration (Brotli compression, Gzip compression)
- too many requests (HTTP requests)
- connection setup costs (DNS lookup time, TLS handshake, Connection reuse)
CrUX won't name these root causes – but it will reliably show the outcome when they regress.
A simple CrUX reporting template (what to tell stakeholders)
When you share CrUX internally, keep it short and decision-oriented:
- Scope: origin vs key URL templates
- Time window: the 28-day period you're viewing
- Outcome:
- pass/fail for LCP, INP, CLS at p75
- distribution change (good/NI/poor) for each metric
- Likely drivers: traffic mix changes, releases, infrastructure events
- Next action: 1–2 prioritized fixes tied to specific page types
This turns CrUX from a "scoreboard" into a management tool.
Bottom line
CrUX is the most practical "reality check" dataset in web performance: it tells you what real Chrome users experienced, aggregated over time, with an emphasis on the slower end of the distribution that most affects satisfaction, SEO, and conversions. Use it to set priorities and validate outcomes – then lean on lab testing and technical diagnostics to figure out what to change.
Frequently asked questions
Use CrUX to judge what real users experienced over the last 28 days and Lighthouse to debug why. CrUX is field data, so it reflects actual devices, networks, and user behavior. Lighthouse is lab data, so it is repeatable for testing changes. In practice, you need both.
CrUX updates daily but reports a rolling 28-day window, so improvements appear gradually as new, faster visits replace older, slower ones. Also, traffic mix can change: a campaign might bring more mobile users or slower regions, offsetting your gains. Validate in lab tests immediately, then confirm in CrUX over time.
For Google's Core Web Vitals assessment, the common goal is passing at the 75th percentile for LCP, INP, and CLS on mobile. For business reporting, also track distribution shift: reducing the poor bucket often matters more than shaving a small amount off already-good experiences. Compare by page type, not site-wide only.
CrUX only reports when there is enough real-user sample volume and the URL is publicly accessible. Low-traffic pages, gated content, and new pages often lack URL-level data. In those cases, use origin-level CrUX, group pages by template, and rely on synthetic testing to catch regressions before traffic accumulates.
Yes – CrUX is public, so you can benchmark origins against peers to set realistic targets and justify investment. But interpret carefully: competitors may have different traffic sources, device mix, and geographies. Use comparisons to identify magnitude of opportunity, then focus your optimization plan on your own biggest page groups and bottlenecks.
Want to take PageVitals for a spin?
Page speed monitoring and alerting for your website. Get daily Lighthouse reports for all your pages. No installation needed.
Start my free trial