Table of contents
Field data vs lab data
Most performance "wins" don't fail because the fix was wrong – they fail because the team optimized the wrong dataset. If your lab test looks fast but real customers still feel lag, you'll see it in bounce rate, conversion rate, and paid traffic efficiency long before you see a celebration in your weekly report.
Field data vs lab data is simply the difference between:
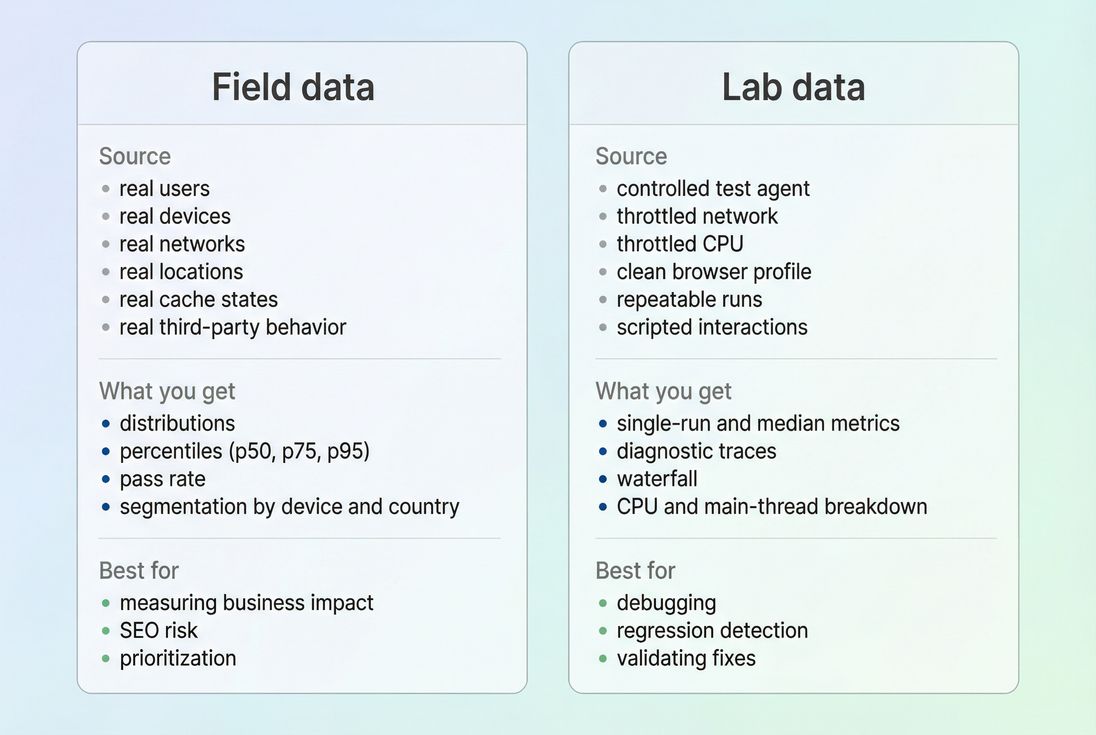
- Field data: performance measurements collected from real users on your live site (real devices, real networks, real behavior).
- Lab data: performance measurements from simulated or controlled tests (same device profile, same network throttling, repeatable runs).
If you care about business impact, field data tells you what customers experience. If you care about debugging and shipping fixes, lab data tells you what to change and whether your change helped.
Which one should you run the business on?
If you're a website owner, CMO, or e-commerce lead, the best mental model is:
- Field data is your KPI.
- Lab data is your engineering tool.
Field data is where you answer questions like:
- "Are mobile shoppers actually getting faster pages?"
- "Did our new personalization vendor slow down the experience?"
- "Which templates are hurting conversions?"
Lab data is where you answer:
- "What exactly is blocking rendering?"
- "Is it TTFB, JavaScript, images, or third parties?"
- "Did the release from last night introduce a regression?"
The Website Owner's perspective: If you report only lab improvements, you can accidentally ship changes that look good in a test but don't move revenue. If you report only field data, you can see the problem but struggle to prove which fix worked. The best teams use field to choose what matters and lab to decide what to do next.
How field data is calculated in practice
Field data is collected from real page visits and then aggregated. That aggregation is the key detail many teams miss.
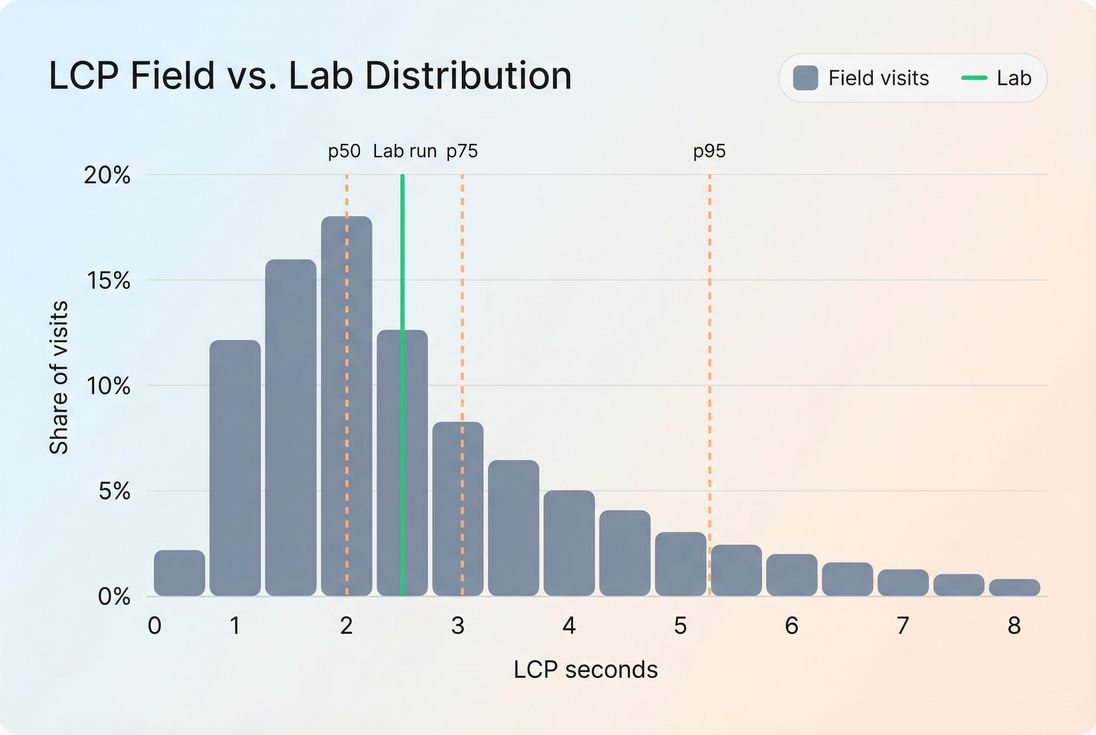
It's a distribution, not a single number
Real-user performance is not one experience – it's thousands of different experiences. A product page might load quickly for:
- repeat visitors with a warm cache,
- desktop users on fast Wi‑Fi,
- customers near your CDN edge,
…and load slowly for:
- first-time visitors (cold cache),
- low-end Android devices,
- rural or congested mobile networks.
Because of that, field reporting is usually shown as:
- Percentiles (commonly p50 and p75 for Core Web Vitals)
- Pass rate (percent of visits rated "good")
For Core Web Vitals, the 75th percentile is widely used because it represents the experience of users who are worse off than "average," without being dominated by extreme outliers.
What gets aggregated (and why it matters)
Field datasets typically aggregate by:
- URL or page group/template
- Origin (domain-wide rollups)
- Device type (mobile vs desktop)
- Sometimes country/region and network quality
This is why you can "fix" a page and see nothing change: you may have improved a subset of traffic that doesn't move the overall 75th percentile much, or your traffic mix shifted (more mobile users, more international traffic, etc.).
If you're using Chrome-based field datasets, review how CrUX data is collected and the time window it represents, because it's not a same-day feedback loop.
How lab data is calculated in practice
Lab data is created by running a test in a controlled environment. The important implication is:
Lab data is repeatable – by design.
The controlled test recipe
A lab test typically fixes variables like:
- device profile (CPU speed, memory)
- network throttling and latency
- browser state (often clean profile, cold cache)
- viewport size
- test location
This makes lab tests ideal for comparing changes "apples to apples," especially when you're working on:
- critical rendering path issues
- render-blocking resources
- JavaScript execution and main thread work
- image and font loading (image optimization, font loading)
Why lab includes different metrics
Lab tooling often emphasizes diagnostic metrics like:
- Total blocking time
- Speed Index
- script evaluation and long tasks
These help pinpoint causes even when field data only tells you the user outcome (for example, INP is bad, but why it's bad requires deeper breakdown).
For a practical example of how these views show up in audits, see PageSpeed Insights, which is a common place people first notice the field vs lab mismatch.
Why field and lab often disagree
When a stakeholder says, "Why is Lighthouse green but customers still complain?" the answer is usually one (or more) of these.
Different inputs
Field and lab differ on the inputs that matter most:
- Device mix: low-end devices can dramatically worsen JS execution time and interaction latency.
- Network variability: real networks have jitter; lab networks are stable.
- Geography: CDN vs origin latency affects TTFB for far-away users.
- Cache state: real users often have partial caches; lab often runs cold (or consistently warm, depending on setup).
- Third parties: tags may behave differently by consent, region, or user cohort (third-party scripts).
Different outputs (point value vs percentile)
Lab is often "one run" (or a median of a handful). Field is a percentile of thousands of visits. These aren't supposed to match exactly.
Different "moments" in the user journey
Lab tests often measure a page load in isolation. Real users:
- navigate from other pages (soft navigations)
- open overlays, filters, and menus
- add to cart and interact with forms
That's why your field INP can be poor even if the lab load looks great – your interactivity problems happen after the initial render.
If your business depends on flows (PDP → cart → checkout), you need lab coverage beyond one URL. Multi-page or scripted testing is often the missing piece.
What changes mean (and what they don't)
A common failure mode is treating every movement as "we got faster" or "we got slower." Here's how to interpret changes safely.
Field data changes: what to conclude
If field p75 improves for:
- LCP: more users are seeing primary content faster. This often correlates with stronger landing page engagement and better conversion efficiency for paid traffic.
- CLS: fewer "rage clicks," fewer mis-taps on mobile, and less perceived jank on PDPs and checkout.
- INP: users are getting faster feedback to taps/clicks (filters, add-to-cart, variant selection), reducing friction where revenue is decided.
But be careful: field improvements can also come from traffic mix shifts, such as:
- a higher share of desktop sessions
- a seasonal shift to repeat visitors
- fewer international users
- a campaign ending that brought in slower devices
Practical guardrail: when field changes, always ask "Did our audience change?" before you declare victory or panic.
Lab data changes: what to conclude
If lab LCP or Speed Index improves, it usually means your release:
- reduced render-blocking work (see critical CSS and unused CSS)
- reduced JavaScript cost (see unused JavaScript and code splitting)
- improved image delivery (see image compression and responsive images)
- improved network setup (see preconnect, DNS prefetch, and connection reuse)
But lab improvements don't guarantee field improvements if the change doesn't help the slow cohorts that dominate your p75 (low-end devices, slow RTT, far geographies).
How to decide what to fix first
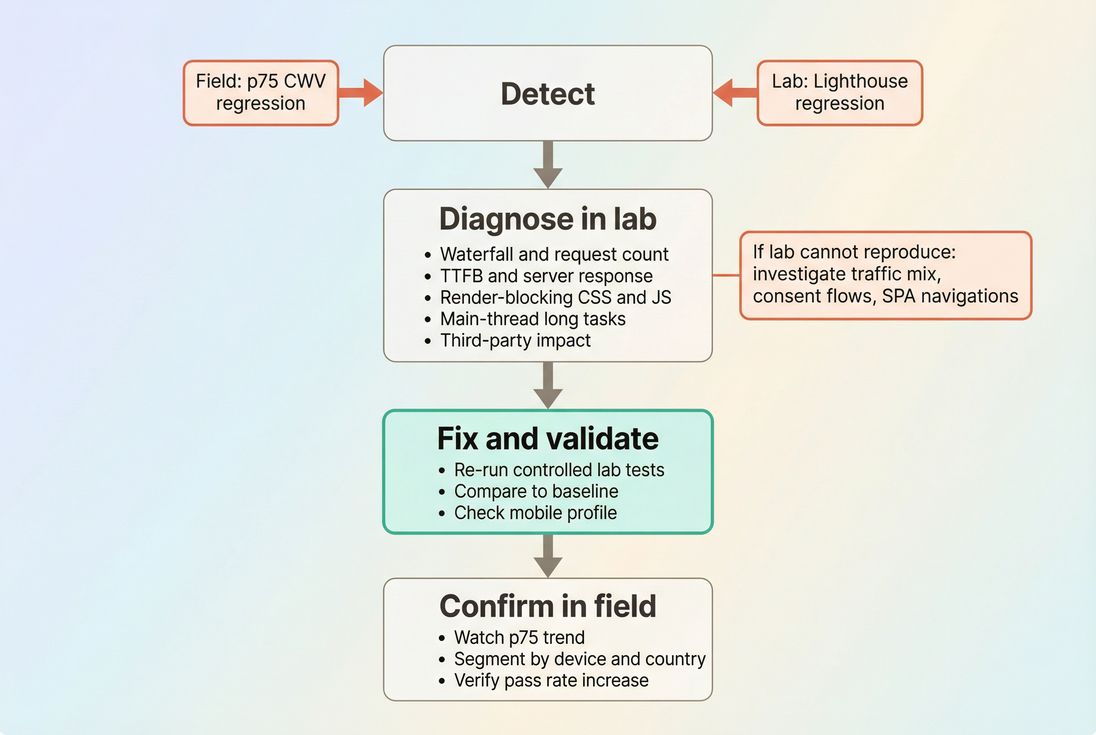
The most practical way to prioritize is to combine the two datasets intentionally:
- Use field to pick the target.
- Use lab to find the constraint.
- Use lab again to confirm the fix.
- Use field to confirm the business outcome.
A decision table you can actually use
| Situation you see | What it usually means | What to do next |
|---|---|---|
| Field p75 LCP is bad, lab LCP is good | Real users have slower devices, worse networks, worse cache states, or location latency | Segment field by device/geo; focus on TTFB, image bytes, caching (Cache-Control headers, browser caching) |
| Lab LCP is bad, field LCP is ok | Your lab profile is stricter than your audience, or the issue affects first visits more than typical visits | Still fix lab regressions to prevent future field decline; check cold-cache behavior and edge caching |
| Field INP is bad, lab looks fine | Interaction cost happens after load or with real third parties/consent | Audit main-thread work, third parties, and long tasks (long tasks) |
| Both field and lab are bad | You have a real, reproducible performance problem | Debug in lab: waterfall, CPU, render blocking, TTFB; ship targeted fixes and re-test |
The Website Owner's perspective: Prioritization is a budget decision. Fix what's measurably hurting users (field), then pick the shortest engineering path to improvement (lab). This avoids wasting cycles on improvements that look good in screenshots but don't move conversion.
A practical workflow for teams
This is the workflow that tends to work for busy teams with limited engineering time.
Step 1: Pick a small set of pages that matter
Don't try to monitor "the whole site" equally. Start with:
- top landing pages from paid and SEO
- category/listing pages (heavy JS and images)
- product detail pages
- checkout entry points
These templates usually dominate revenue impact.
Step 2: Track field Core Web Vitals as the outcome
Field is where you track the customer experience of:
Also keep an eye on supporting indicators like mobile page speed patterns and geography/network shifts.
If you're implementing field collection yourself, review measuring Web Vitals so you don't accidentally compare incompatible definitions or sampling.
Step 3: Use lab tests to get actionable diagnostics
In lab, your goal isn't just a score – it's causality. Common "root cause buckets" and where to look:
- Slow server delivery: server response time, TTFB, CDN performance, edge caching
- Too much render blocking: critical CSS, render-blocking resources, asset minification
- Too much JavaScript: JS bundle size, unused JavaScript, code splitting
- Main thread overload: reduce main thread work, long tasks
- Heavy media: image formats WebP vs AVIF, lazy loading
Step 4: Don't let test setup create false disagreements
A classic way teams create noise is by letting lab tests include things real users don't see (or vice versa). Two examples:
- Cookie banners: your lab run may block interaction or layout in ways that aren't representative. If you need to remove them for consistency, use a documented approach like /docs/guides/removing-cookie-consent-banners-from-your-lighthouse-tests/.
- Script loading order: changing
async/defercan improve lab metrics but hurt real interactivity depending on the script and page. Review async vs defer and validate with interaction-focused checks.
How website owners should set targets
Targets need to reflect how each dataset behaves.
Use field targets for accountability
For Core Web Vitals, set targets on:
- p75 for each vital
- pass rate for each template group
This aligns teams with the customer experience, not a lab-only proxy.
Use lab targets for release safety
Lab targets are ideal for preventing regressions because they're fast and repeatable. A practical approach is a performance budget:
- define acceptable ranges for key lab metrics (LCP proxy, blocking time, request count, JS bytes)
- fail a release when budgets are exceeded
For the concept, see performance budgets. For how teams implement budgets in monitoring and automation, see /docs/features/budgets/.
The Website Owner's perspective: Field targets keep everyone honest about customer experience. Lab budgets keep your team from accidentally "taxing" every future release with extra JavaScript, extra requests, and slower rendering.
Where PageVitals docs fit (when you're operationalizing)
If you're operationalizing both datasets, the most useful views tend to be:
Field-focused Web Vitals reporting (what users experience):
/docs/features/field-testing/web-vitals/ and the specific reports for /docs/features/field-testing/web-vitals/lcp-report/, /docs/features/field-testing/web-vitals/inp-report/, /docs/features/field-testing/web-vitals/cls-report/CrUX-based context (when you need Chrome's field dataset):
/docs/features/chrome-ux-report/Lab diagnostics when you're debugging a regression (what caused it):
/docs/features/network-request-waterfall/A clear conceptual comparison for teams aligning on methodology:
/docs/guides/synthetic-vs-field-testing/
The shortest way to avoid bad decisions
If you only remember one rule, use this:
- If you're making prioritization decisions, start with field.
- If you're making engineering decisions, start with lab.
- If they disagree, don't average them – explain the disagreement.
In practice, the teams that win treat field vs lab as a partnership:
- Field data tells you which users are unhappy and where it hurts.
- Lab data tells you what to change and how to verify it quickly.
- Your job is to connect them so improvements show up both in reports and in revenue.
Frequently asked questions
Trust field data to understand real business impact because it reflects what customers actually experience across devices, networks, and locations. Use lab data to diagnose and validate fixes quickly. In practice, field data sets the goal and lab data explains the why and verifies the how.
Lab tests are controlled and usually represent a single device and connection profile, while field metrics are percentiles across your real traffic mix. If slow devices, weak networks, or specific geographies dominate your 75th percentile, field scores can stay flat even after lab improvements.
It depends on the source. CrUX-style field datasets typically reflect a rolling multi-week window, so improvements may take weeks to fully show. First-party RUM can update faster. Also, if only a small share of users hit the changed page or template, the signal can arrive slowly.
For Core Web Vitals, prioritize the 75th percentile because it's designed to represent a "typical bad day" user experience. Pair it with a pass rate (percent of visits rated good) to understand breadth. Avoid averages alone; they hide slow cohorts and regressions.
Start with what's failing in field data (usually p75 LCP, INP, or CLS). Then reproduce and break down causes in lab: TTFB, render-blocking resources, main-thread work, and third-party scripts. Fix the dominant constraint, validate in lab, and confirm trend improvement in field.
Want to take PageVitals for a spin?
Page speed monitoring and alerting for your website. Get daily Lighthouse reports for all your pages. No installation needed.
Start my free trial