Table of contents
First contentful paint (FCP)
A slow First Contentful Paint (FCP) is what "feels broken" to users: the click lands, nothing changes, and they start doubting your site. Even if your checkout is fast and your product pages eventually render, that blank-screen moment increases early bounces and weakens trust – especially on paid traffic landing pages.
First Contentful Paint (FCP) is the time from when navigation starts to when the browser first paints any content from the DOM – like text, an image, or an SVG – on the screen. It's the first moment the page stops being visually blank.
The Website Owner's perspective: FCP is your earliest "did the page respond?" signal. When FCP improves, more users stay long enough to see your offer, your navigation, and your page structure – even before the hero finishes loading.
What FCP tells you
FCP is primarily a metric about how quickly the browser can begin rendering, not about when the page is fully usable or when the main content is visible.
It's most useful for diagnosing issues in the early load sequence:
- Slow backend or edge delivery (often visible in TTFB)
- A blocked critical rendering path (CSS and synchronous JavaScript)
- Font loading behavior delaying text paint (see font loading)
- Heavy early main-thread work (see reduce main thread work)
How FCP differs from LCP
FCP is the first visible pixel of page content. Largest Contentful Paint (LCP) is when the main content (often the hero image or headline block) appears.
A page can have:
- Good LCP, bad FCP: users stare at white space, then the hero appears quickly once rendering finally starts.
- Good FCP, bad LCP: users see something (like nav text), but the main content is still slow.
Both patterns matter, but they imply different fixes. FCP is more about "can the browser paint yet?" and less about "did the main asset load?"
What counts as content
FCP triggers when the browser paints the first piece of rendered DOM content. Common examples:
- Text (including a header, nav, or even a single character)
- Images (including background images applied to elements may contribute indirectly depending on implementation)
- Non-white
<canvas>content - SVG content
What doesn't count:
- A background color change on the
<body>with no content - Purely offscreen rendering
- The browser UI itself (address bar changes, spinner)
Practically, FCP can be "cheated" by painting a tiny piece of text early – but that's not the goal. The goal is to start rendering real above-the-fold structure quickly (see above-the-fold optimization).
How FCP is measured
FCP is reported in both lab tools (like Lighthouse) and in field measurement (real users), but those two contexts behave differently. If you haven't already internalized that split, read field vs lab data.
In the browser
Under the hood, browsers expose paint timing entries (Paint Timing API). FCP is taken from the first "contentful" paint event after navigation begins.
Two important implications:
- FCP is gated by HTML arrival. No HTML, no DOM, no content, no FCP. That's why TTFB and early HTML bytes matter.
- FCP is gated by render readiness. Even if HTML arrives, the browser may delay painting until it can safely render (commonly because CSS is render-blocking, or because the main thread is busy executing JavaScript).
In lab tests
Lab FCP is typically measured under simulated conditions (device, CPU, network) and is very sensitive to:
- Test location and throttling profile
- Cache state
- Variance in third-party scripts
This is why lab is best for debugging and field is best for business impact.
If you're using Lighthouse-based tooling, it helps to understand related lab metrics like Speed Index and total blocking time.
What good looks like
Use benchmarks as decision tools, not as vanity grades. Here's a practical way to frame it.
Common thresholds (lab)
Lighthouse commonly categorizes FCP roughly like this:
| FCP (lab) | Interpretation | What it usually means |
|---|---|---|
| ≤ 1.8s | Good | Server is responsive and render-blocking resources are controlled |
| 1.8s–3.0s | Needs work | Some blocking CSS/JS, fonts, or backend latency is creeping in |
| > 3.0s | Poor | Users perceive the page as "not loading" |
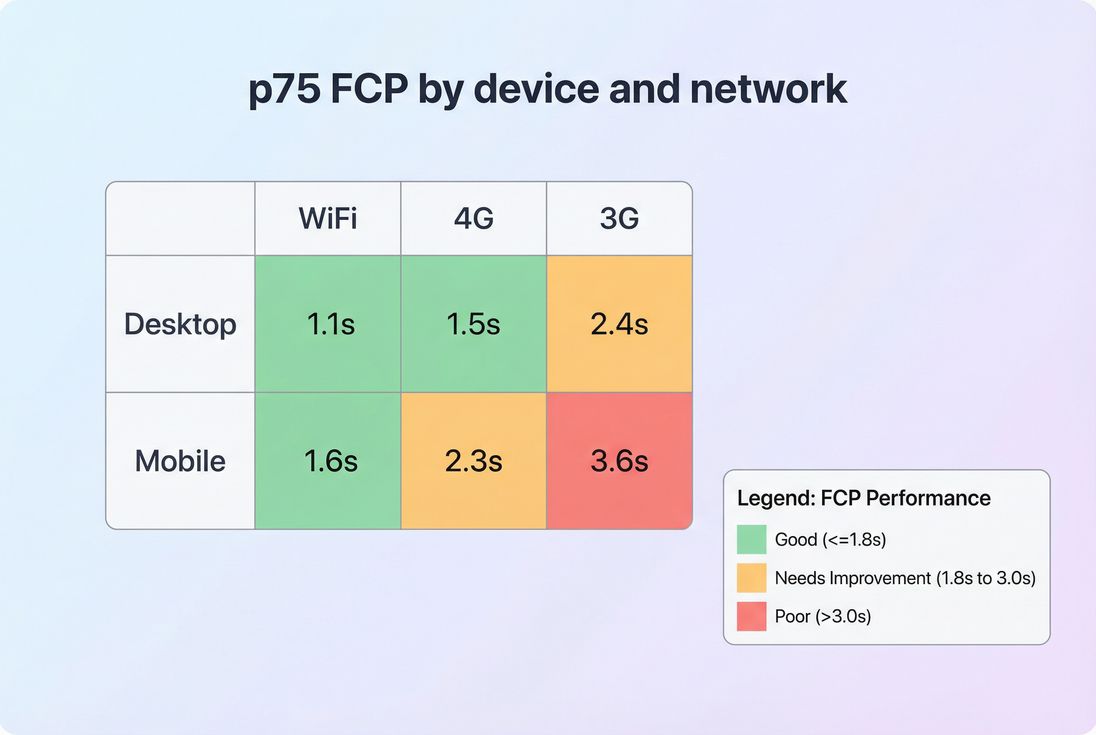
How to judge field FCP
Field data (often from CrUX data) should be evaluated at the 75th percentile (p75), segmented by:
- Mobile vs desktop
- Country/region
- Network quality (RTT, effective connection type)
A "good average" can hide a real problem. For ecommerce, the users you lose are often in the slower tail (older phones, busy networks), so p75 (and sometimes p90 internally) is where decisions become obvious.
The Website Owner's perspective: Don't only ask "is FCP green?" Ask "what percent of paid traffic experiences a blank screen for 3+ seconds?" That number is closer to your bounce rate than any single median.
Why FCP gets slow
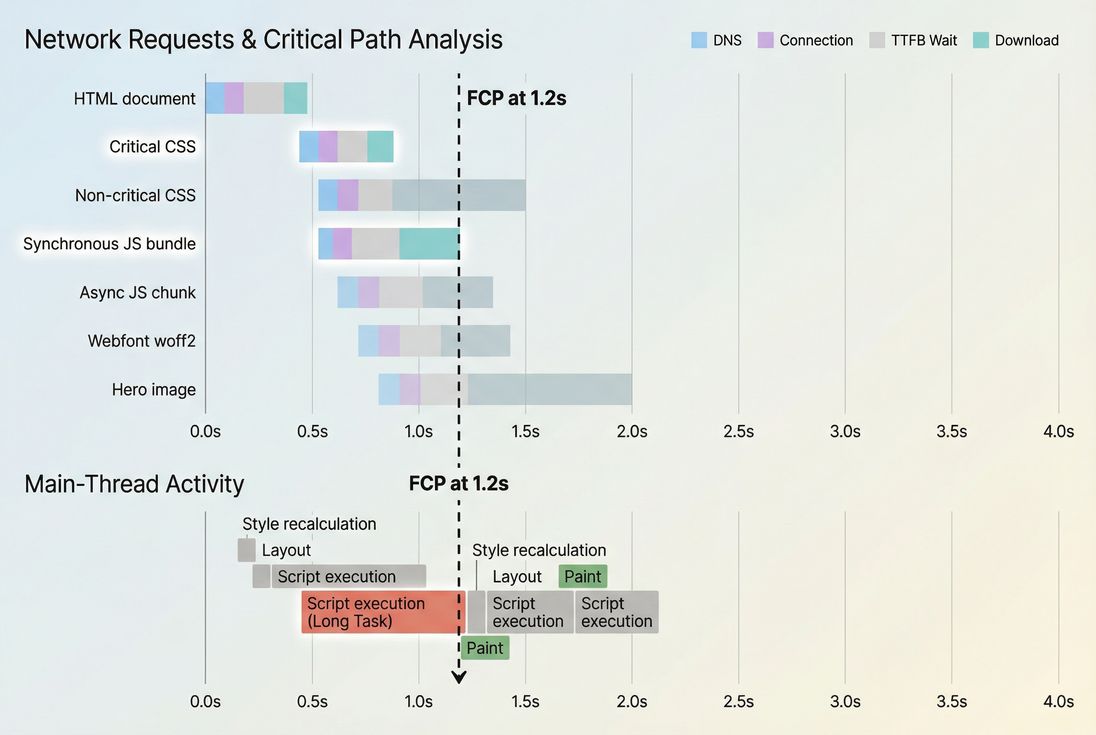
FCP is usually delayed by one of four buckets. The fastest way to debug is to figure out which bucket dominates your slow runs.
- Slow TTFB: the browser is waiting on the server before it can even start parsing.
- Render-blocking CSS: the browser has HTML, but it delays painting until critical CSS is downloaded and processed.
- Main-thread contention: JavaScript executes early and ties up the thread needed to render.
- Font delays: text exists in the DOM but can't paint (or is hidden) until the font strategy allows it.
The "shape" of the problem becomes obvious when you see the timeline of network + CPU leading up to FCP.
Common real-world patterns
Pattern A: high TTFB → high FCP
If server response time is inconsistent, FCP will be inconsistent too. Typical causes:
- Uncached HTML on the origin
- Slow database queries
- Geographic distance without a CDN
- TLS and connection setup overhead (see TLS handshake and TCP handshake)
Pattern B: "CSS wall" before paint
Even with decent TTFB, you may see the browser wait on multiple CSS files. Causes:
- Too much global CSS shipped to every page
- CSS delivered late due to dependency chains
- CSS not compressed/minified (see asset minification and Brotli compression)
Pattern C: JavaScript executes before first paint
If a large synchronous bundle runs before the first render, FCP drifts. Causes:
- Not using async vs defer correctly
- Shipping too much unused code (see unused JavaScript)
- No code splitting
Pattern D: web fonts delay text
Fonts can delay paint depending on font-display and how CSS is structured. If text is your earliest content (often is), fonts can make FCP worse.
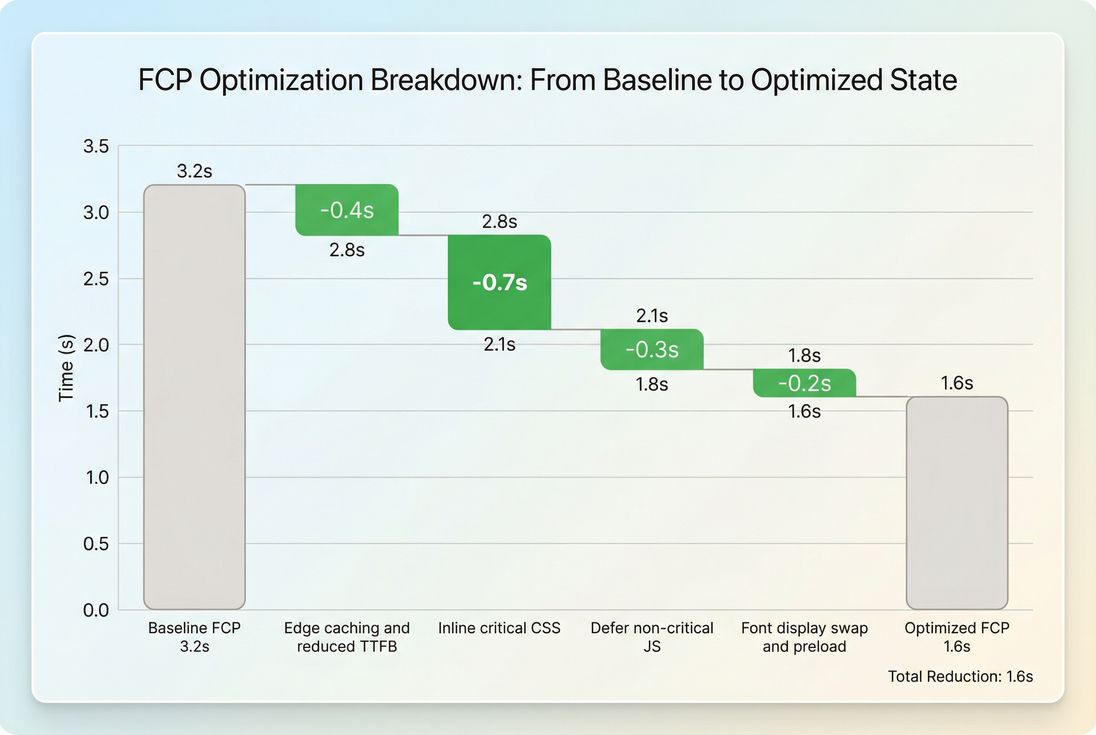
How to improve FCP (the practical playbook)
Good FCP improvements tend to come from removing things that block first paint, not from micro-optimizing everything.
1) Reduce TTFB variability first
FCP can't be stable if your HTML isn't stable.
Focus on:
- Strong caching headers for HTML where appropriate (see Cache-Control headers and browser caching)
- Edge delivery and correct TTL strategy (see edge caching and effective cache TTL)
- CDN routing and origin latency (see CDN performance and CDN vs origin latency)
- Compression (Brotli/Gzip) to reduce transfer time (see compression)
If your TTFB is spiky, fix that before deep frontend work. Otherwise you'll chase noise.
2) Eliminate render-blocking CSS
This is the most common "pure FCP" win.
Actions that typically move the needle:
- Inline the minimum critical CSS needed to render above-the-fold structure
- Defer non-critical stylesheets (load after first paint)
- Reduce and remove unused CSS
- Minify CSS (see asset minification)
The key mindset: ship less CSS before the first paint, not necessarily less CSS overall.
3) Defer JavaScript that doesn't help first paint
FCP often suffers because the browser is busy running JavaScript or waiting on synchronous scripts before it can paint.
Priorities:
- Mark non-critical scripts with
defer(see async vs defer) - Break up bundles via code splitting
- Reduce JavaScript execution time by removing unused libraries and delaying hydration work
- Audit third-party scripts that inject tags, personalization, chat, or analytics before the page renders
A simple rule: if it doesn't change what the user sees at first paint, it should not run before first paint.
4) Make fonts non-blocking
Font strategy is often a silent FCP killer.
Common fixes:
- Use
font-display: swap(or similar strategy) so text paints with a fallback font immediately - Preload the most critical font files (see preload)
- Reduce font variants and weights
- Ensure fonts are cacheable long-term with strong TTL
This is usually a "small but consistent" FCP win, and it reduces the blank-screen feeling on text-heavy pages.
5) Optimize above-the-fold images carefully
Because FCP can be triggered by an image, you might assume "load the hero first." But for many pages, the fastest path to a good FCP is actually:
- Paint text and layout quickly
- Load the hero image slightly after, without blocking render
Use modern formats and sizing to reduce transfer time (see image optimization, responsive images, and WebP vs AVIF).
What improvement looks like in practice
How to interpret FCP changes over time
FCP is sensitive to releases, third-party tags, and backend variability. When you see movement, interpret it like this:
If FCP improves but conversion doesn't
That can happen when:
- You improved early paint, but INP is still poor (page "shows" but feels laggy)
- The content painted at FCP isn't meaningful (e.g., only a header)
- LCP is still slow, so users see "something" but not the product/value
Use FCP as an early indicator, then validate with LCP and INP for business outcomes.
If FCP worsens after a redesign
Common causes:
- Heavier CSS frameworks or more global CSS
- More web fonts, heavier font files
- More client-side rendering work before first paint (hydration)
- New third-party scripts loaded early
Treat a rising FCP as a signal to review the render-blocking resources and the amount of early JavaScript work.
The Website Owner's perspective: When FCP regresses, it often correlates with "new stuff we added" rather than organic decay. Use it as a release gate: if FCP jumps on key templates, ship a rollback or defer the new tag until after render.
How to debug and monitor FCP
To take action on FCP, you need two views:
- Field view: which users are impacted, and where
- Lab view: what exactly is blocking paint
Field: segment the problem
Start with CrUX-style segmentation if possible (see CrUX data). You're looking for patterns like:
- Mobile-only regressions
- Country-specific slowness (routing or CDN)
- Spikes that correlate with releases or tag changes
If you're using PageVitals field reports, the docs for CrUX reporting are here: Chrome UX Report.
Lab: find the blocking step
In lab tooling, FCP debugging usually comes down to answering:
- Is the page waiting on TTFB?
- Which resource is the last render-blocker before paint?
- Is the main thread busy running JavaScript?
A network waterfall makes this mechanical. If you're using PageVitals synthetic results, the most relevant view is the waterfall documentation: Network request waterfall. For Lighthouse-based runs, see Lighthouse tests.
Visualize where your worst users are
Where FCP fits in your metric stack
FCP is not a Core Web Vital by itself, but it complements them:
- Use FCP to catch "blank screen" regressions early.
- Use LCP to ensure the main content appears fast.
- Use CLS to ensure the page doesn't jump as it renders.
- Use INP to ensure the page responds quickly once users try to interact.
If you want the bigger picture of how these relate, see Core Web Vitals and web performance metrics.
Quick decision checklist (what to do next)
- If TTFB is high or inconsistent, start with caching, CDN, and backend response work.
- If TTFB is fine but FCP is slow, focus on render-blocking CSS and early JavaScript execution.
- If FCP is good but users still complain, shift attention to LCP and INP (perceived completeness and responsiveness).
For a tool-specific definition and how it's reported in PageVitals, reference: First Contentful Paint documentation.
Frequently asked questions
In Lighthouse lab tests, aim for FCP under 1.8 seconds, with 1.8 to 3.0 seconds as a warning zone and over 3.0 seconds as poor. For real users, judge the 75th percentile by device and country. Mobile on slower networks should still be consistently under 2 to 2.5 seconds.
Yes. LCP can be fine while FCP is slow, which means users stare at a blank page before the main content appears. That hurts perceived speed and increases early bounces, especially on landing pages. FCP also flags render blocking CSS, font delays, and client-side rendering issues that might not fully show up in LCP.
Third-party scripts often add render blocking requests, extra DNS and TLS handshakes, and main thread work early in the load. Even when scripts are async, they can trigger layout and style recalculation or inject CSS. The result is delayed first paint. Audit what runs before paint and defer everything non-essential.
Start by separating them. If TTFB is high, FCP cannot be consistently good because the browser cannot render until the HTML starts arriving. Fix server response time, caching, and CDN behavior first. If TTFB is already solid, the bigger wins usually come from reducing render blocking CSS and JavaScript execution before paint.
Render blocking resources plus early JavaScript work. A typical pattern is multiple CSS files, large framework bundles, and fonts that delay text rendering. The page technically downloads quickly, but it cannot paint. Focus on the critical rendering path: ship minimal CSS for above-the-fold, defer non-critical JS, and make fonts non-blocking.
Want to take PageVitals for a spin?
Page speed monitoring and alerting for your website. Get daily Lighthouse reports for all your pages. No installation needed.
Start my free trial