Table of contents
Google PageSpeed Insights guide (Only capitalize the first word)
A slow page is a revenue leak: it quietly lowers conversion rate, inflates paid acquisition costs, and increases support load from frustrated users. Google PageSpeed Insights (PSI) is valuable because it turns performance into a set of measurable bottlenecks you can prioritize and fix.
Google PageSpeed Insights is a Google tool that analyzes a URL using two lenses:
- Field data (real-user performance from the CrUX data, when available)
- Lab data (a Lighthouse test run in a controlled environment)
Together, PSI answers two business-critical questions: what users are actually experiencing and what engineering changes are most likely to improve it.
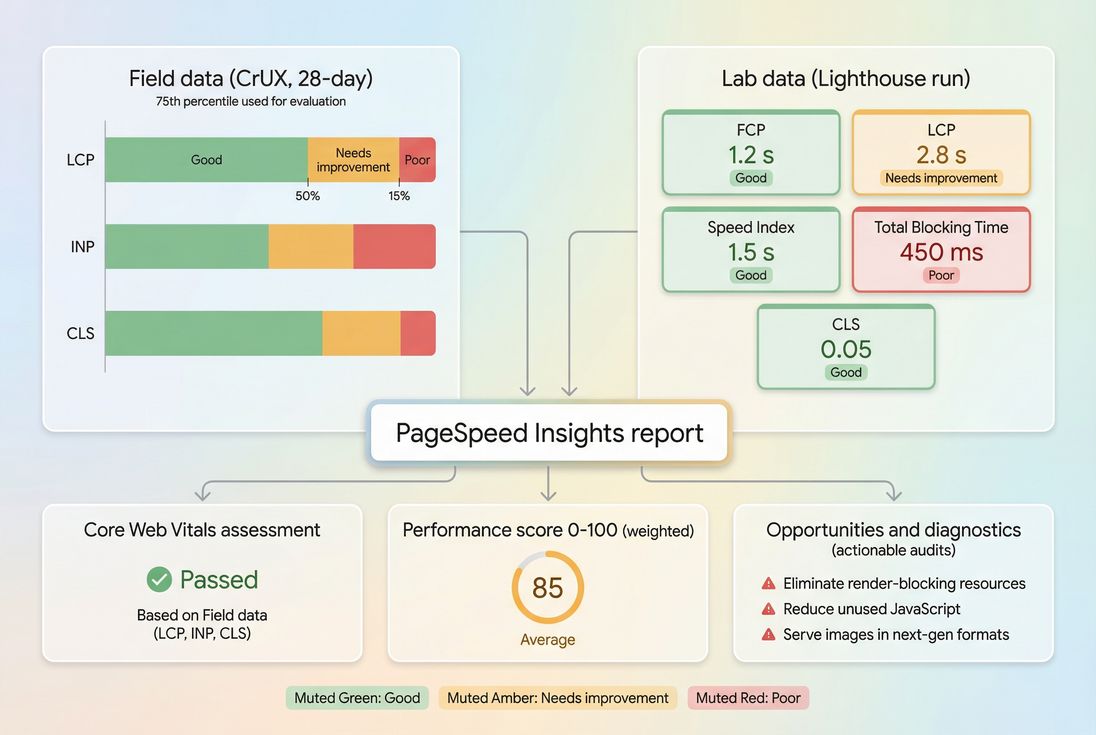
PageSpeed Insights blends real-user CrUX outcomes with a Lighthouse lab run, so you can separate what users feel from what you can directly debug.
What PSI actually tells you
PSI is not a single metric. It's a report with three different "truths" that serve different decisions:
Core Web Vitals status (field)
If CrUX data exists for your URL or origin, PSI shows whether you pass the Web Vitals assessment based on real-user percentiles. This is what matters most for broad SEO risk management and user experience outcomes. See Core Web Vitals for the big picture.Performance score (lab)
A 0–100 score derived from a Lighthouse run. This is excellent for debugging and regression tracking, but it's not the same thing as "Google ranking," and it's not the same thing as field Web Vitals.Opportunities and diagnostics (lab)
Actionable audits (examples: render-blocking resources, unused JS, image sizing) that help you create an engineering plan.
The Website Owner's perspective
Use PSI field data to decide where to invest (which templates and problems are hurting users). Use PSI lab data to decide what to ship next (which specific bottlenecks to fix first).
How the performance score is calculated
The PSI Performance score comes from Lighthouse. Lighthouse measures several lab metrics, converts each into a 0–100 sub-score using a calibrated scoring curve, then combines them using weights.
In most modern Lighthouse versions, the Performance score is primarily influenced by:
- Largest Contentful Paint (LCP) – how fast the main content appears (LCP)
- Total Blocking Time (TBT) – how much JavaScript blocks the main thread in the lab (Total blocking time)
- Cumulative Layout Shift (CLS) – layout stability (CLS)
- Plus FCP and Speed Index (secondary contributors)
Important nuance:
- TBT is a lab proxy, often correlated with responsiveness problems, but it is not INP. INP is field-based (INP).
Why a score can improve without helping users
It's possible to "game" the score accidentally:
- Deferring work might lower TBT in the test but delay useful interactivity for real users
- Optimizing a non-critical above-the-fold element might raise the score but not move conversion
- Removing one large request might help lab LCP but not help field LCP if your real bottleneck is server latency or personalization
That's why you should read PSI from the metrics upward (LCP/INP/CLS), not from the score downward.
Field vs lab: when to trust each
PSI mixes two data sources because they answer different questions. Understanding the boundary prevents wasted effort.
Field data (CrUX): what users actually experienced
CrUX is aggregated data from real Chrome users. PSI typically shows:
- Distribution (good / needs improvement / poor)
- 75th percentile values (commonly used for Web Vitals evaluation)
- A rolling window (not instant feedback)
What this means in practice:
- If you ship a fix today, field results may take time to reflect it.
- A small set of pages can drag down an "origin" assessment if they get most traffic.
Related reading: Field vs lab data and Measuring Web Vitals.
Lab data (Lighthouse): how to debug and reproduce
Lighthouse runs a simulated test with controlled throttling. That makes it great for:
- Reproducing issues consistently
- Comparing before/after changes
- Pinpointing causes via audits and the waterfall
But lab tests can miss:
- Personalization and A/B testing variance
- Third-party behavior that differs by geography/time
- Real device constraints and browser extensions
- Cached vs uncached differences in the wild
The Website Owner's perspective
Field data tells you if you have a brand-level performance problem. Lab data tells your developer exactly what to fix in the next sprint.
Benchmarks that matter for decisions
Here are the thresholds website owners should use most often.
Core Web Vitals (field) thresholds
| Metric | Good | Needs improvement | Poor |
|---|---|---|---|
| LCP | ≤ 2.5s | 2.5s–4.0s | > 4.0s |
| INP | ≤ 200ms | 200ms–500ms | > 500ms |
| CLS | ≤ 0.1 | 0.1–0.25 | > 0.25 |
If you're prioritizing work for SEO risk reduction and user experience, these thresholds typically beat any single Lighthouse score target.
Performance score (lab) categories
| Lighthouse Performance score | Interpretation |
|---|---|
| 90–100 | Generally strong lab performance |
| 50–89 | Real opportunities; prioritize biggest bottlenecks |
| 0–49 | Fundamental issues: server, render-blocking, heavy JS, or huge media |
A practical target for many businesses is: get key templates into the 80–95 range and keep them there, while ensuring Web Vitals pass in field data.
How to read PSI like an operator
Most people scan PSI top-to-bottom and jump straight into "Opportunities." A more reliable workflow is:
Start with field Core Web Vitals (if available)
Are you failing LCP, INP, or CLS? Which one is the main failure?Then check lab LCP and TBT
These point to what Lighthouse can reproduce. A bad lab LCP with a good field LCP can still matter (it can indicate regressions for uncached users), but it changes urgency.Use diagnostics to confirm the cause
Don't "fix everything." Fix the bottleneck that dominates the failing metric.
A fast way to interpret the Opportunities list
Think of PSI audits in three buckets:
Direct Core Web Vitals impact
Example: Render-blocking resources often affect LCP.Efficiency and cost control
Example: Unused JavaScript reduces CPU time and can improve INP/TBT.Hygiene / best practices
Valuable, but not always the next dollar of impact.
What usually drives bad PSI results
When PSI looks bad, it's almost always one (or more) of these root causes.
Slow server response and delivery
If TTFB is high, everything else stacks on top of it:
- Origin latency, slow backend, heavy middleware
- Poor cache strategy (missing Cache-Control headers, short Cache TTL)
- Network distance and congestion (consider CDN performance, CDN vs origin latency)
Start here: TTFB and Server response time.
LCP bottlenecks above the fold
Common LCP killers:
- Unoptimized hero image (wrong format, too large, not responsive)
- Render-blocking CSS/JS delaying first render
- Fonts delaying text rendering (Font loading)
- Too much work in the critical rendering path
Most effective first fixes:
- Proper image optimization and modern formats (WebP vs AVIF)
- Critical CSS and above-the-fold optimization
- Script loading discipline: Async vs defer
JavaScript main-thread overload (TBT/INP risk)
If PSI shows heavy TBT, your site is doing too much JS work during page load:
- Large bundles (JS bundle size)
- Too much execution time (JS execution time)
- Framework hydration overhead
- Third-party tags and consent tools (Third-party scripts)
High-leverage remedies:
- Code splitting
- Remove dead code (Unused JavaScript)
- Break up long tasks (Long tasks, Main thread work)
Layout instability (CLS)
CLS is often caused by:
- Images without width/height
- Late-loading banners (promo, cookie, chat)
- Fonts swapping without planning
Start here: Layout instability and Zero layout shift.
How to interpret CrUX distributions
When PSI has field data, it usually shows a distribution, not just a single number. That matters because business outcomes are typically harmed by the slow tail.
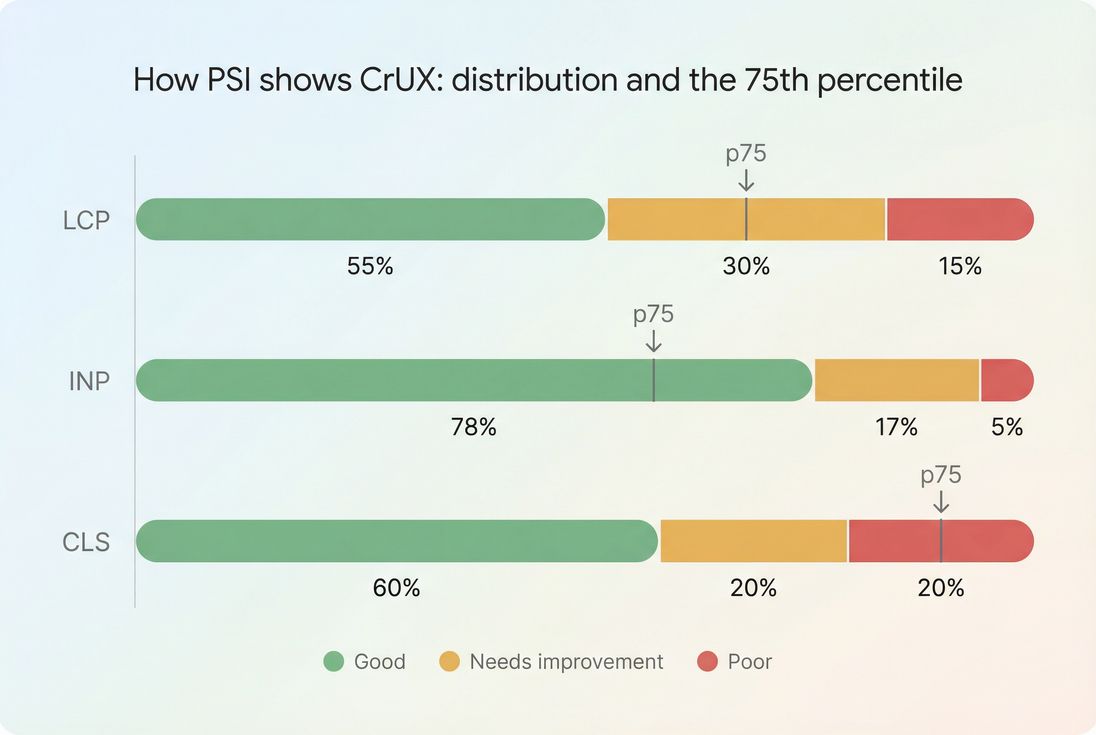
The distribution view helps you see whether you have a small slow tail or a broad performance problem across most users.
What changes in the distribution mean
- Good segment grows: more users are having a fast experience (usually the goal)
- Poor segment shrinks: you're fixing the worst cases (often the biggest conversion win)
- 75th percentile crosses a threshold: you may move from failing to passing Core Web Vitals
This is why it's risky to manage performance using only averages.
Turning PSI into a prioritized action plan
PSI can produce a long list of audits. The trick is to pick the subset that is most likely to move your failing metric on your highest-value templates.
A practical prioritization method
Pick one template and one goal
- Example: "Product detail page, improve mobile LCP."
Identify the dominant constraint
- High TTFB? Start server/cache/CDN.
- LCP element is a huge image? Start image and preload strategy.
- TBT is massive? Start JS and third parties.
Ship the smallest change that proves impact
- Example: convert hero to AVIF + responsive sizing + preload (often beats a full redesign)
Re-test and confirm movement
- Use the same PSI mode (mobile vs desktop) and compare the underlying metrics, not just the score.
The Website Owner's perspective
A good roadmap is not "fix every audit." It's "fix the one bottleneck that blocks our Web Vitals pass rate on the pages that drive revenue."
Common "highest ROI" fixes by metric
If LCP is failing
- Reduce server latency (TTFB, caching, Edge caching)
- Optimize the LCP resource (often the hero image): Responsive images, Image compression
- Reduce render delay: Critical CSS, Render-blocking resources
If INP is failing (field) or TBT is high (lab)
- Cut third-party cost: Third-party scripts
- Reduce JS: Unused JavaScript, Code splitting
- Reduce main-thread contention: Long tasks, Main thread work
If CLS is failing
- Reserve space for media and embeds
- Stabilize banners and late UI
- Fix font swapping strategy: Font loading
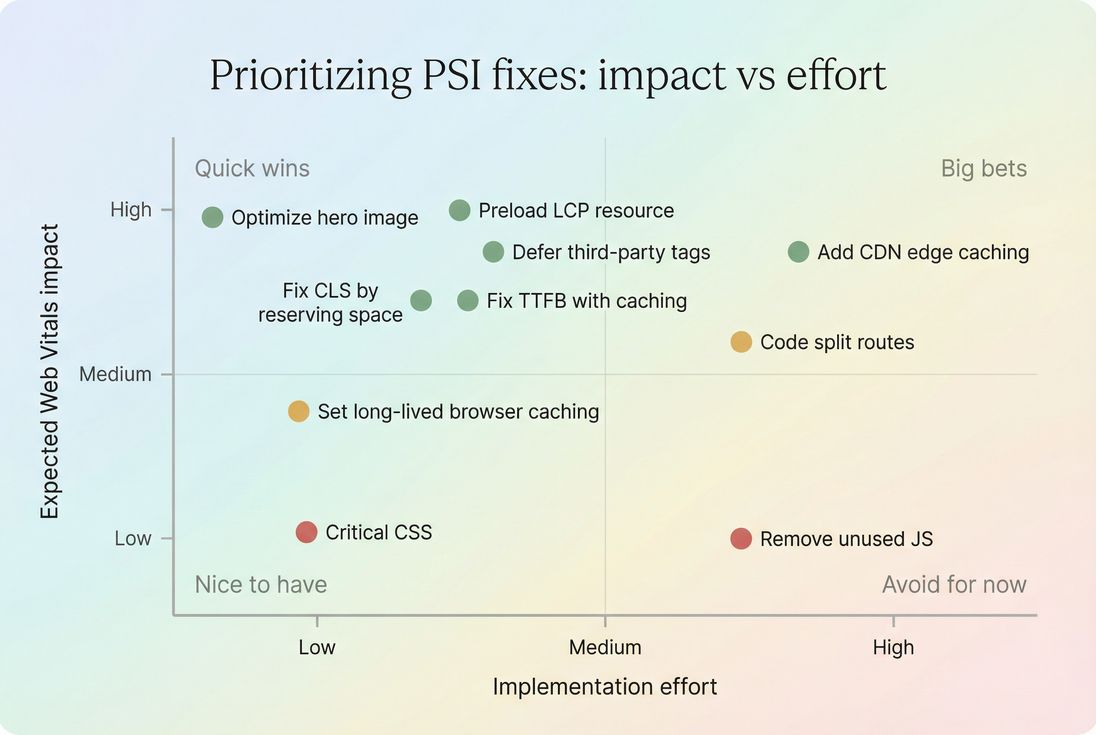
Use an impact vs effort view to avoid busywork and focus on changes that actually move LCP, INP, or CLS on revenue-driving templates.
Why PSI changes after "small" releases
If PSI shifts after a tiny code change, it usually indicates one of these realities:
- You touched a shared dependency (tag manager, framework chunk, CSS base)
- Caching changed (new hash busts cache; altered headers; CDN miss)
- Third-party variance (ads/analytics behavior changed)
- Main thread tipping point (a small amount of JS pushed tasks over a threshold, increasing Long tasks)
How to respond:
- Confirm with repeated lab runs (don't trust a single run)
- Check whether the change affected LCP element, render blocking, or JS execution
- Compare mobile first (Mobile page speed)
Using PSI without wasting time
A few rules that keep PSI productive:
- Don't chase 100. Chase passing Core Web Vitals and stable performance on key templates.
- Don't treat every audit as equal. Many audits are informative but not urgent.
- Don't ignore network/server. Front-end tweaks can't overcome bad TTFB.
- Don't optimize in the wrong environment. Always prioritize mobile unless your business is truly desktop-only.
If you need deeper debugging beyond PSI, the next level is understanding the request waterfall and what blocks rendering (see HTTP requests and the critical rendering path).
Monitoring and preventing regressions
PSI is excellent for spot-checking and debugging, but performance work sticks only when you operationalize it.
Practical approaches:
- Set performance budgets per template and block regressions before they ship (see Performance budgets).
- Track field Web Vitals trends and segment by page type and device class (see Real user monitoring).
If you're using PageVitals specifically, these docs explain how to operationalize Lighthouse and budgets in the product:
- Lighthouse test setup and reporting: /docs/features/lighthouse-tests/
- Performance budgets: /docs/features/budgets/
- CI/CD automation options: /docs/ci-cd/
- Waterfall analysis in reports: /docs/features/network-request-waterfall/
The Website Owner's perspective
The win is not a one-time score improvement. The win is preventing future releases, marketing tags, and experiments from quietly pushing you back into failing LCP/INP/CLS.
A simple PSI workflow for ecommerce
If you want a repeatable process that maps to revenue:
- Pick 5–10 highest-traffic templates (home, category, product, cart, checkout steps)
- Check CrUX Web Vitals (pass/fail and which metric is failing)
- Use Lighthouse lab to reproduce (focus on the failing metric)
- Fix the dominant bottleneck (one change per iteration)
- Re-test and monitor field trend (expect lag in CrUX)
That's how PSI becomes a decision tool – not a score-chasing exercise.
Frequently asked questions
Treat the score as a diagnostic summary, not your business KPI. Use it to spot problems and compare before and after on the same page template and settings. For SEO and user experience decisions, prioritize the Core Web Vitals results and the underlying timing metrics.
PageSpeed Insights uses a lab test (Lighthouse) that is sensitive to network variability, CPU timing, third party behavior, and cache state. Small swings are normal. Run 3 to 5 tests and look for consistent movement in LCP, TBT, and CLS rather than chasing a 1 to 3 point score change.
Field data is what real users experienced over a rolling window and is what Google uses for Core Web Vitals evaluation. Lab data is best for debugging because it is repeatable and provides audits. Use field data to choose priorities and success criteria, then use lab to find the fixes.
Aim for LCP under 2.5 seconds, INP under 200 milliseconds, and CLS under 0.1 at the 75th percentile. For Lighthouse, 90 plus is a solid target, but do not block releases to hit a perfect 100. Prioritize mobile performance and key landing and product templates.
Start with the audits tied to your biggest user facing problems: LCP element, render blocking resources, unused JavaScript, and third party impact. Estimate effort and validate impact with before and after tests. Ship changes that improve a Core Web Vital or reduce server and main thread work.
Want to take PageVitals for a spin?
Page speed monitoring and alerting for your website. Get daily Lighthouse reports for all your pages. No installation needed.
Start my free trial