Table of contents
Reducing main thread work
A slow main thread doesn't just "feel a bit laggy." It can directly reduce conversion rates by delaying "Add to cart," breaking smooth scrolling on product lists, and making checkout inputs miss keystrokes on midrange phones. If your site is already paying for traffic, a busy main thread is quietly lowering the value of every visit.
Main thread work is the total time the browser's main thread spends doing CPU work to load, render, and run your page (JavaScript execution, parsing, style calculation, layout, paint, and more). When that thread is busy, the browser can't respond quickly to user input or paint updates.
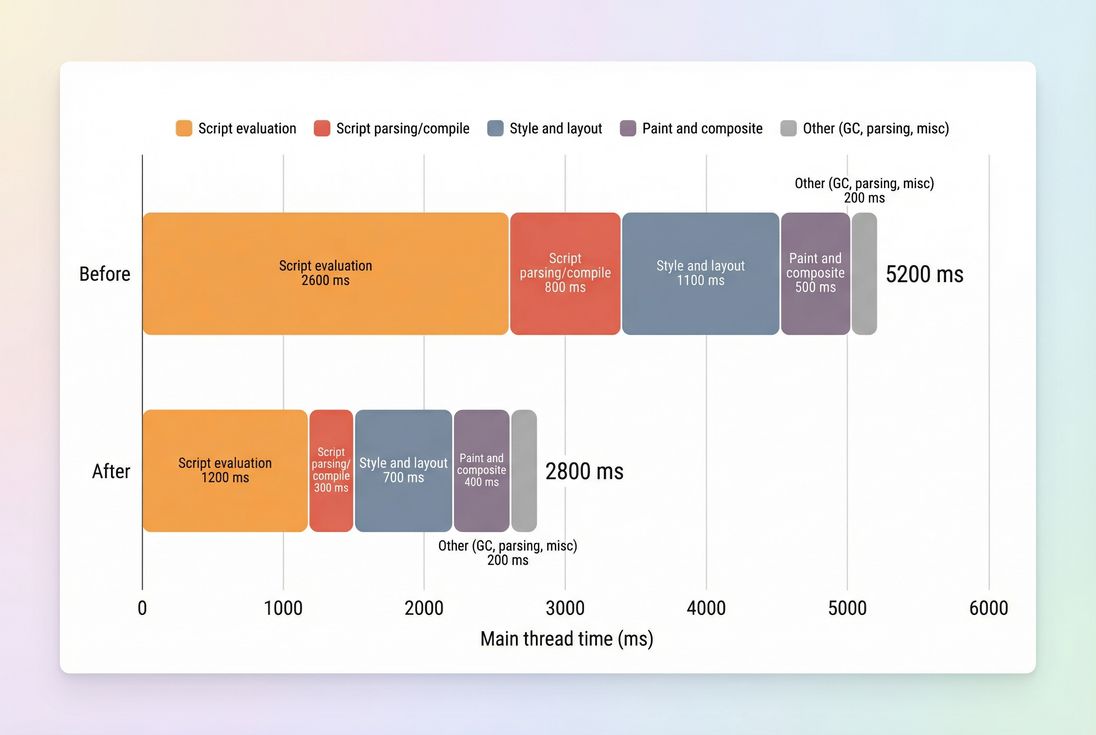
A simple breakdown like this tells you whether you have a JavaScript problem, a rendering problem (style/layout), or both – and makes prioritization obvious.
What this metric reveals
Main thread work is a "root cause" metric: it doesn't describe what the user sees directly, but it explains why visible and interactive metrics get worse.
The main thread is responsible for:
- Running JavaScript (parsing/compiling/evaluating)
- Building the DOM and CSSOM (parsing HTML/CSS)
- Calculating styles and layout (including reflows)
- Painting and compositing pixels to the screen
- Handling input events (tap/click/scroll), scheduling work, and some accessibility processing
- Garbage collection (GC) and other runtime overhead
When any of that takes too long, you get the classic symptoms: delayed clicks, janky scrolling, "dead taps," and text inputs that feel behind.
The Website Owner's perspective: Main thread work is your "responsiveness capacity." If it's overloaded, improvements in CDN, caching, or image formats may still leave the site feeling slow at the exact moments that matter – PDP interactions, cart updates, and checkout form entry.
How it's calculated (in practice)
In lab tools like Lighthouse, Chrome records a performance trace during page load. The "main thread work" number is essentially the sum of CPU time spent on main-thread tasks within the measured window, grouped into buckets such as script evaluation, style/layout, and paint.
Key nuance: this is CPU time, not wall-clock time.
- If the page takes 6 seconds to load but the main thread only works for 2 seconds, you have more of a network/IO issue (see TTFB and network latency).
- If the page loads in 6 seconds and main thread work is 5 seconds, you have a CPU/congestion issue – usually JavaScript and rendering.
Main thread work vs long tasks
Main thread work becomes user-visible when it clusters into long tasks (typically tasks longer than ~50 ms). Long tasks block input and delay paints, which directly impacts metrics like Total Blocking Time (lab) and INP (field).
If you only remember one thing: total main thread work tells you magnitude; long tasks tell you pain.
For more context on long tasks specifically, see Long tasks.
When it becomes a problem
Website owners usually ask, "What's too high?" The exact number depends on device class, but you can use practical ranges for Lighthouse-style mobile tests.
| Main thread work (mobile lab) | What it usually means | Typical impact |
|---|---|---|
| < 2,000 ms | Generally healthy | Good responsiveness headroom; fewer long tasks |
| 2,000–4,000 ms | Congested on midrange devices | Higher risk of sluggish UI; TBT often elevated |
| > 4,000 ms | CPU-bound | Long tasks likely; interaction lag and jank common |
Two important interpretation tips:
- Look for concentration, not only totals. A page with 3,000 ms spread out can feel better than a page with 2,500 ms that includes multiple 300–800 ms long tasks.
- Compare apples to apples. Use consistent device/network profiles and compare the same templates (home vs collection vs PDP vs checkout step).
The Website Owner's perspective: If your marketing team keeps adding tags and your product team keeps adding UI logic, main thread work is the metric that reveals whether you're still operating within a "performance budget" or silently accumulating conversion-killing friction. (See Performance budgets.)
How it affects Core Web Vitals
Main thread work often shows up as "mystery regression" in user metrics because it's upstream of multiple outcomes.
INP (responsiveness)
INP is the most direct victim. A busy main thread delays:
- event handling (your JS can't run yet)
- rendering updates (the "next paint" is late)
- layout work required to paint changes
So even if the network is fast, the UI feels slow.
LCP and FCP (rendering milestones)
While LCP and FCP are influenced by network and server work, main-thread congestion can still delay them by:
- blocking HTML parsing with synchronous scripts
- delaying style calculation/layout needed to render above-the-fold content
- slowing down image decode and paint scheduling on constrained devices
This ties directly into the critical rendering path and problems like render-blocking resources.
CLS (less direct, but real)
CLS is not "caused" by high main thread work, but heavy scripting and late rendering can increase the chance you inject content late or measure layout incorrectly, especially with third parties.
Where it usually comes from
Most main-thread work problems are not "one big thing." They're a few predictable buckets that repeat across sites.
JavaScript execution (most common)
This includes:
- framework runtime and hydration
- large component trees rendering on load
- expensive state initialization
- polyfills or legacy bundles sent to modern browsers
- repeated work due to poor caching/memoization
Start with JavaScript execution time and JS bundle size, but don't stop at size – execution cost is the killer on mobile CPUs.
High-impact tactics here:
- Code splitting
- Unused JavaScript
- Async vs defer
- Reducing third-party footprint (see below)
Third-party scripts (often the biggest surprise)
Tag managers, A/B testing, chat widgets, reviews, attribution pixels, fraud tools – many run early and often. Even if they're "async," they still execute on the main thread once downloaded.
See Third-party scripts for governance patterns and sequencing.
Style and layout work
Even with modest JS, main thread time can spike from:
- huge DOMs on category pages (thousands of nodes)
- complex CSS selectors or expensive effects
- repeated layout thrashing (read/write cycles)
- heavy web font behavior (FOIT/FOUT patterns)
Related reading:
Paint and composite
Paint/composite time grows with:
- large fixed backgrounds, blurs, shadows, filters
- big sticky headers with complex subtrees
- many layers promoted to the compositor
- expensive animations (especially layout-triggering ones)
Paint issues can be subtle: the site "looks fast" but scroll feels sticky.
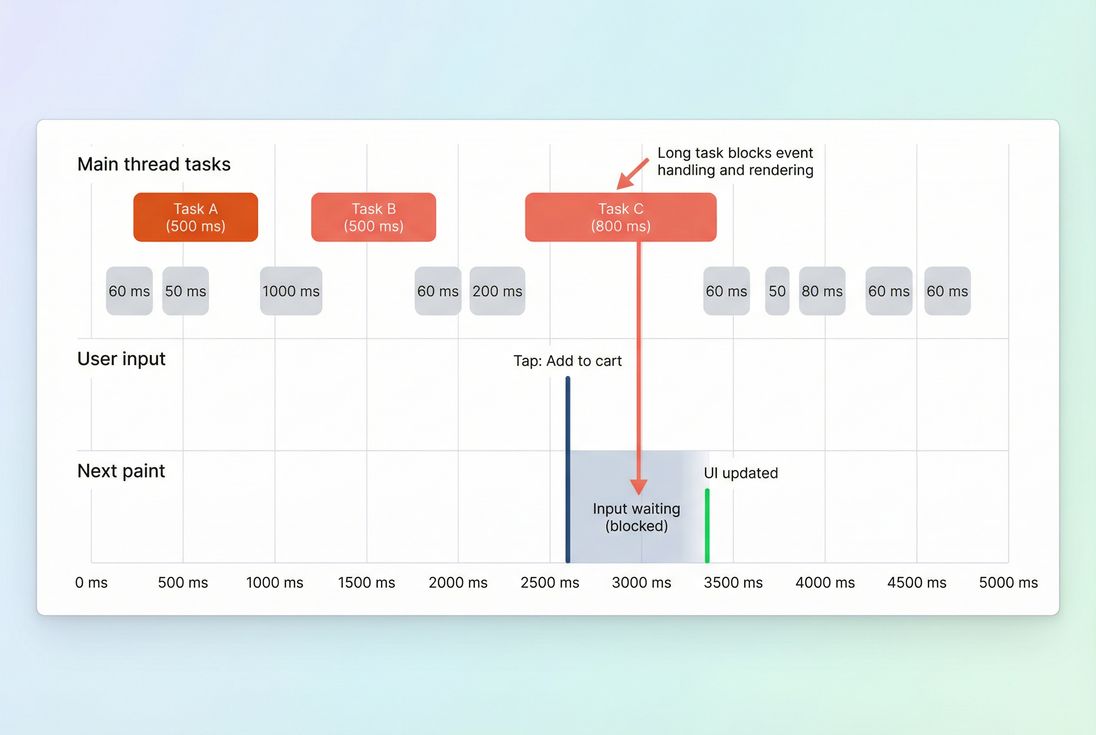
Long tasks are where main thread work becomes user-visible: the input happens, but the UI can't respond until the thread is free and a paint can occur.
How to diagnose it fast
You want to answer two questions quickly:
- What category is dominating? (Script vs style/layout vs paint)
- Which files/features are responsible? (Your app vs third parties)
Use a lab trace to find the "why"
In a Lighthouse run, the main thread breakdown shows where CPU time went. Then you confirm in a browser trace (Chrome DevTools Performance) to see:
- which script bundles are executing
- which functions are hot
- whether layout is recalculating repeatedly
- where long tasks occur
If you're using PageVitals Lighthouse tests, the same workflow is easier when paired with trace-based opportunities and drill-downs. Two relevant docs:
Separate network wait from CPU work
A common mistake is to "optimize JavaScript" when the real bottleneck is waiting on slow origin responses. Before deep JS surgery, verify basics like:
The Website Owner's perspective: This is prioritization protection. If your bottleneck is origin latency, engineering weeks spent shaving 300 ms of JS won't move the revenue needle like fixing TTFB and caching first.
Confirm with field signals (indirectly)
There is no single "main thread work" field metric in CrUX. But you can validate impact via:
- improved INP distribution
- reduced rage clicks and increased engagement in your analytics
- fewer "slow interaction" spikes in RUM
Also remember the difference between field vs lab data: lab is where you find causes; field is where you validate outcomes.
How to reduce it safely
Reducing main thread work is about doing less upfront, and doing the remaining work in a way that doesn't block input or rendering.
1) Cut startup JavaScript
This is usually the highest ROI.
Do less on initial load:
- Split code so product page logic doesn't ship to homepage visitors (Code splitting).
- Remove dead code and unused dependencies (Unused JavaScript).
- Minify and compress to reduce parse/compile time (Asset minification, Brotli compression, Gzip compression).
Load it without blocking rendering:
- Use async vs defer correctly for non-critical scripts.
- Avoid injecting synchronous scripts in the head unless truly required.
Practical e-commerce example: don't initialize reviews, recommendations, chat, and analytics "enhanced mode" before the user can see price, images, and the first CTA.
2) Reduce third-party CPU cost
Treat third parties like vendors, not snippets.
High-leverage moves:
- Delay non-essential tags until after the page is interactive (or after user action).
- Gate by consent where applicable.
- Replace "do everything" libraries with smaller, purpose-built ones.
- Remove overlapping tools (two session replay tools, multiple pixels doing the same job).
This is operationally hard, but it's often where the biggest wins hide.
3) Simplify rendering work
If style/layout dominates:
- Reduce above-the-fold complexity (fewer DOM nodes, fewer heavy components).
- Avoid layout thrash (batch DOM reads and writes).
- Remove unused CSS and limit expensive selectors (Unused CSS).
- Consider critical CSS so rendering can start sooner.
If paint/composite dominates:
- Reduce expensive visual effects in critical UI.
- Prefer transform/opacity animations over layout-triggering animations.
- Watch sticky headers, drawers, and overlays with large subtrees.
4) Break up long tasks
Sometimes you can't remove work – you can only schedule it better.
Approaches:
- Split heavy initialization across multiple tasks (so input can be processed between them).
- Lazy-load below-the-fold widgets (Lazy loading).
- Move truly parallelizable computation off the main thread (Web Workers), especially data processing.
Be careful: moving work doesn't always reduce total CPU, but it can reduce blocking and improve responsiveness.
5) Set guardrails (so it stays fixed)
Main thread work tends to creep back. The sustainable fix is governance:
- Set per-template budgets (home, collection, PDP, checkout).
- Track changes in long tasks and JS execution time in CI.
- Require approval for new third-party scripts.
If you're using PageVitals, budgets can be enforced via the budgets feature docs:
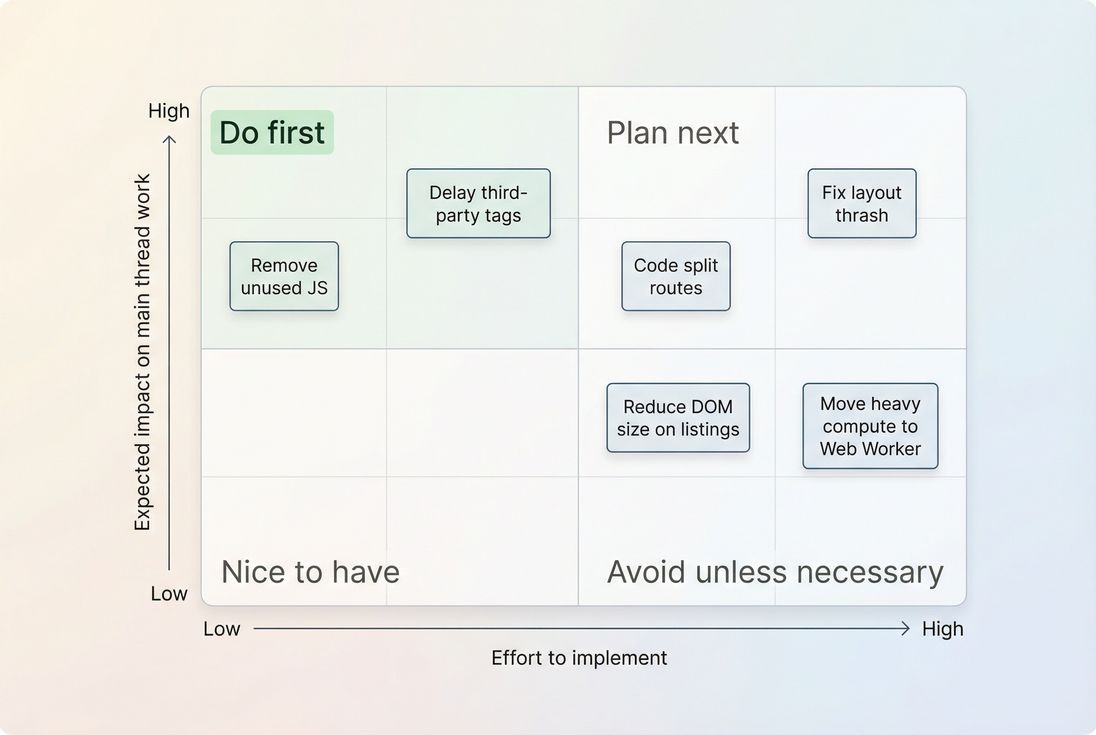
A prioritization view helps teams stop debating and start sequencing: target low-effort/high-impact CPU wins first, then tackle structural rendering issues.
How website owners should interpret changes
Main thread work improvements are meaningful when they translate into fewer delays at the moments that matter.
Here's how to read trends responsibly:
If main thread work drops, but conversion doesn't move
Common reasons:
- You improved load-time CPU, but interaction CPU (filters, add-to-cart, checkout validation) is still heavy → focus on INP pathways.
- The bottleneck is network/server (TTFB, caching, third-party endpoints) → revisit CDN vs origin latency and HTTP requests.
- You optimized a low-traffic template instead of the funnel-critical ones.
If main thread work drops, but LCP doesn't improve
That can happen when LCP is dominated by:
- slow image delivery/decoding → see image optimization and WebP vs AVIF
- render-blocking CSS → see render-blocking resources
- slow server response → see server response time
If main thread work drops, and INP improves
That's the "clean win" pattern. It usually means you removed or delayed blocking script, reduced long tasks, or made interaction handlers lighter.
The Website Owner's perspective: An INP improvement after reducing main thread work often shows up as fewer "dead taps" and fewer abandoned steps in checkout – especially on mobile. That's not a vanity metric; it's friction removed from the revenue path.
A practical action plan (30–60 minutes)
If you need a fast, no-drama plan:
- Run a mobile lab test on your top templates (home, category, PDP, cart/checkout step).
- Record main thread work + long tasks and note whether script or style/layout dominates.
- List top third parties loaded before interaction; challenge each one.
- Ship one safe win:
- remove unused JS
- delay one non-critical third party
- fix one render-blocking script or CSS issue
- Re-test and validate movement in TBT (lab) and INP directionally (field).
For measurement context, review:
Reducing main thread work is less about chasing a single number and more about protecting your site's ability to respond instantly. When you treat the main thread like a constrained resource – budget it, defend it, and spend it on what users actually need – you get faster interactions, steadier Web Vitals, and a smoother path to conversion.
Frequently asked questions
As a practical rule, aim for under 2 seconds of total main thread work in a Lighthouse-style mobile test on key landing pages. Between 2 and 4 seconds usually means users will feel lag on midrange phones. Over 4 seconds strongly correlates with long tasks, higher Total Blocking Time, and worse INP risk.
Often, but not always. A smaller bundle can still execute slowly if it includes heavy frameworks, too much hydration, or expensive rendering work. Also, third-party tags may dominate your CPU time regardless of your app bundle. Focus on actual JavaScript execution time and long tasks, not only kilobytes.
Main thread work is not a Core Web Vital by itself, but it is a root cause behind poor INP and can delay rendering milestones like FCP and LCP. When the main thread is busy, clicks and taps wait longer, and updates paint later. Reducing main thread congestion improves responsiveness and perceived speed.
Sometimes. You can delay non-critical third parties, load them after consent, use async or defer correctly, and reduce how much they run at startup. But if a tag consumes hundreds of milliseconds of CPU at load or on interaction, there is usually no free win. Vendor choices and governance matter.
Start with a Lighthouse trace and look at the main thread breakdown and long tasks list. Then confirm in DevTools Performance where time goes: script evaluation, style and layout, or paint. In PageVitals, Lighthouse tests and the Long tasks opportunity report help you spot the biggest CPU offenders quickly.
Want to take PageVitals for a spin?
Page speed monitoring and alerting for your website. Get daily Lighthouse reports for all your pages. No installation needed.
Start my free trial