Table of contents
Speed index explained
A slow-looking page loses money even when it eventually "loads." Shoppers decide in seconds whether the site feels trustworthy and responsive. Speed Index helps you quantify that first impression: how quickly the page becomes visually complete, not just when a single element appears.
Speed Index is a Lighthouse lab metric that estimates how fast the visible part of the page fills in during load. Lower is better. A good Speed Index means users see a mostly complete page quickly, which usually translates to lower bounce and more engaged browsing.
What Speed index actually reveals
Speed Index answers a practical question:
- How long does it take for the page to look mostly done to a human?
Unlike single-point metrics (like FCP or LCP), Speed Index is sensitive to everything visible changing over time: headers, hero sections, product grid placeholders becoming real content, fonts swapping, and images popping in.
This makes it especially useful when:
- Your page technically hits LCP, but still "feels blank" or unstable for too long.
- A redesign introduces progressive rendering that looks slower, even if total load time didn't change.
- Marketing adds third-party tags and the site starts painting later and more slowly.
The Website Owner's perspective
Speed Index is a "does it feel fast" check. If Speed Index worsens, expect higher bounce on landing pages and more abandonment before product discovery – especially on mobile. It's often the earliest warning that above-the-fold experience got heavier.
How Speed index is calculated
Speed Index is calculated from a recorded visual timeline during a Lighthouse run:
- Lighthouse captures a video-like filmstrip of the page loading.
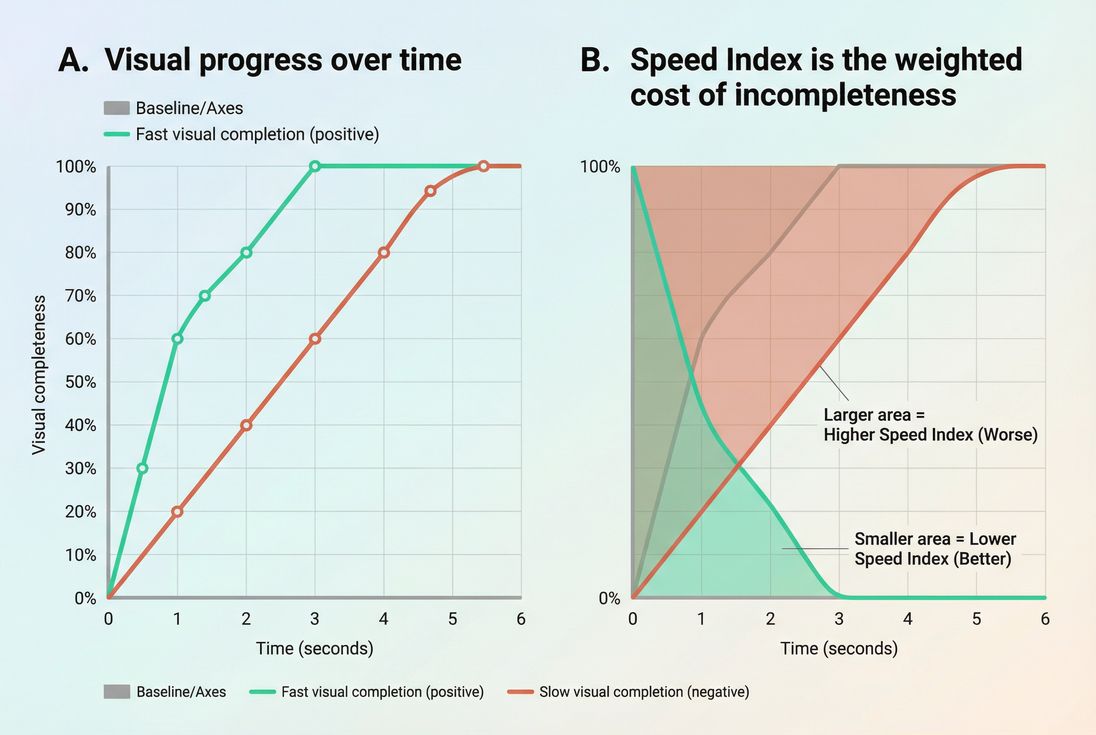
- It computes visual progress for each moment: how close the current frame is to the final fully rendered frame (a percentage).
- It summarizes how quickly the page moved from 0% → 100% visual completeness.
You don't need the math to use it, but the intuition matters:
- A page that reaches 80–90% visual completeness early will usually have a much better Speed Index.
- A page that stays visually sparse for the first few seconds (even if it finishes later) will score much worse.
Why it can disagree with other metrics
Speed Index can move in a different direction than other metrics because it measures a different experience.
- LCP improves, Speed Index worsens: You optimized the hero image but introduced slower rendering for everything else (fonts, CSS, JS).
- FCP improves, Speed Index unchanged: Something small paints earlier, but meaningful above-the-fold content still fills in slowly.
- Speed Index improves, conversions don't: You improved early paint with skeleton UI, but real product images or above-the-fold pricing still arrive late.
For context on how to balance metrics, see Web performance metrics and Core Web Vitals.
What good looks like in practice
In Lighthouse scoring guidance, common ranges are:
| Speed Index (Lighthouse) | Interpretation | What users usually feel |
|---|---|---|
| ≤ 3.4s | Good | Page appears quickly and steadily completes |
| 3.4–5.8s | Needs improvement | "Something is happening," but it feels slow |
| > 5.8s | Poor | Long blank/partial state, high bounce risk |
Two important caveats:
- Speed Index is lab data, not field data. It's sensitive to test device/network settings. Use it alongside the "lab vs field" concept in Field vs lab data.
- Your "good" target depends on page type. Checkout and PDPs should typically be tighter than content pages because they're closer to revenue.
The Website Owner's perspective
For most e-commerce teams, the goal isn't chasing a perfect score. It's preventing regressions on high-traffic landing pages and keeping the "first impression" fast enough that shoppers start browsing instead of bouncing.
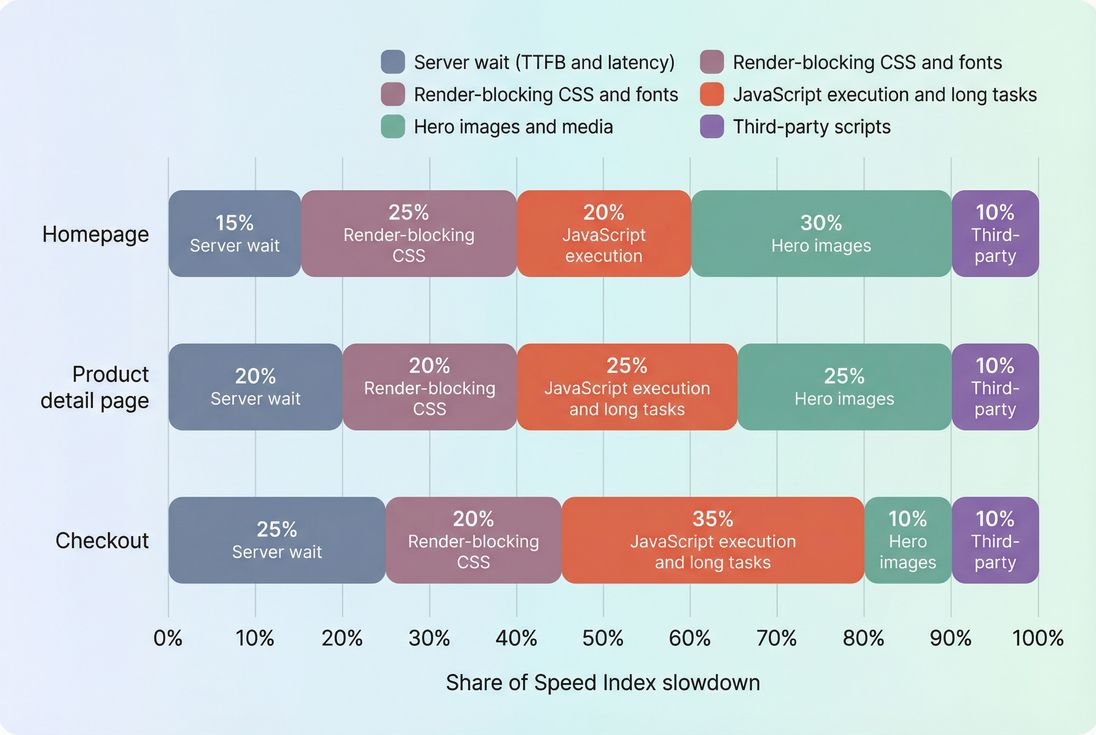
What typically makes Speed index worse
Speed Index worsens when the browser can't paint meaningful pixels early and continuously. These are the usual suspects.
Render-blocking CSS and fonts
If critical styling is delayed, the browser may hold back painting or paint in incomplete steps. Focus areas:
Common real-world pattern: a theme update adds another CSS bundle and a couple of web fonts. The page becomes "white longer," then snaps into place.
Slow server response and high latency
If HTML arrives late, everything shifts right.
Too much JavaScript upfront
Heavy JS can delay rendering even if network is fine, because the browser is busy parsing and executing scripts instead of painting.
This is one of the most common causes of "it downloads fast but still looks slow."
Heavy above-the-fold media
Large hero images, background videos, and sliders can dominate early rendering.
Layout shifts and late swaps
Even though Speed Index is not a stability metric, late-loading fonts and components can cause repeated visual changes that slow perceived completion.
How to interpret changes you see
Speed Index is most useful when you treat it like an operational signal:
Small changes vs meaningful shifts
Because it's a lab metric, minor movement can be noise. In practice:
- ~0–5% movement: often test variance unless it repeats consistently
- ~10–20% worse: usually a real regression worth triaging
- >20% worse: typically a visible problem (new blocking CSS, tag, heavy hero)
The key is consistency: compare like-for-like test settings and rerun enough times to see a stable pattern.
What an improvement usually means
When Speed Index improves, users typically see:
- earlier text and structure (navigation, headings)
- fewer long "blank" moments
- smoother progression to a complete hero/product grid
This often improves engagement even before you see big changes in revenue metrics, because users start interacting sooner.
When Speed Index can mislead you
Speed Index can look better without delivering a better shopping experience if:
- you paint a fast skeleton but delay real product images/prices
- you show a full-screen loader that paints quickly, then wait on data
- you defer important above-the-fold content too aggressively (misused Lazy loading)
Use Speed Index alongside LCP (meaningful content) and interaction metrics like INP.
The Website Owner's perspective
If Speed Index improves but bounce and conversion don't, assume you improved "appearance" more than "usefulness." Re-check whether the first screen includes real product imagery, price, and primary call to action – or just placeholders.
How to improve Speed index (the fixes that matter)
Speed Index improves when you make above-the-fold pixels appear earlier and more steadily. Here's a practical, high-impact order of operations.
1) Make HTML arrive fast
If the browser gets HTML late, nothing else matters.
- Reduce TTFB with caching and backend improvements
- Use CDN performance and Edge caching where it fits
- Set correct Cache-Control headers and improve Effective cache TTL
- Enable modern compression like Brotli compression (or Gzip compression as fallback)
2) Remove render blockers above the fold
This is the classic Speed Index killer.
- Inline or otherwise prioritize Critical CSS
- Defer non-critical CSS and eliminate Unused CSS
- Use Asset minification to reduce bytes and parse time
- For scripts, choose Async vs defer deliberately
If you haven't mapped your Critical rendering path, do that first – Speed Index is heavily determined there.
3) Reduce main-thread work early
Even on fast networks, heavy JS can delay painting.
- Split bundles with Code splitting
- Reduce JS bundle size
- Remove Unused JavaScript
- Fix Long tasks and reduce Main thread work
4) Optimize above-the-fold images properly
For most commerce pages, the hero and the first product images drive perceived load.
- Serve modern formats: WebP vs AVIF
- Apply Image compression
- Use correct Responsive images so mobile doesn't download desktop assets
- Preload the true hero image when it's the LCP element: Preload
5) Be careful with lazy loading
Lazy loading can help, but it can also backfire if you lazy-load what users immediately need.
- Lazy-load below-the-fold content only
- Avoid lazy-loading the hero, header, or primary above-the-fold imagery
- Validate that visual completeness improves, not just byte counts
How website owners use Speed index to decide what to ship
Speed Index becomes actionable when you connect it to real decisions: which changes are safe, which pages deserve attention first, and what to roll back.
Prioritize the pages that earn money
A common approach:
- Landing pages (paid + SEO)
- Category and search results
- Product detail pages
- Cart and checkout
If your team is spread thin, focus on the pages where a slower "first impression" directly increases paid acquisition waste and lowers conversion.
Treat third-party scripts as a budgeted cost
New chat widgets, A/B tools, personalization, and trackers often harm Speed Index by delaying early paint and adding main-thread work.
Use a performance budget mindset:
- define acceptable regression thresholds
- hold new tags to those thresholds
- remove or delay tags that don't prove business value
See Performance budgets for the concept and tradeoffs.
Validate changes with repeatable testing
Because Speed Index is lab-based, you want repeatability:
- keep device/network/test settings consistent
- compare medians of multiple runs
- test key templates and key flows
If you run Lighthouse tests in PageVitals, see how Speed Index appears in reports under the metric documentation: Speed Index and the test setup context: Lighthouse tests. For debugging, a request timeline is often decisive: Network request waterfall.
Where Speed index fits with Core Web Vitals
Speed Index is best treated as a supporting diagnostic metric:
- Use Speed Index to understand perceived visual speed in the lab.
- Use LCP to ensure the main content becomes visible quickly.
- Use INP (and lab proxies like Total blocking time) to ensure the page responds quickly once it appears.
If Speed Index is poor, it often signals you're paying a "visual tax" from render blockers, heavy JS, or slow delivery – issues that frequently hurt CWV too.
The Website Owner's perspective
Speed Index is great for catching "we made it feel slower" problems during redesigns and campaigns. Core Web Vitals are what you track for user experience and platform expectations. Treat Speed Index as the early-warning sensor that tells you where to look before customers complain.
Practical checklist for your next improvement sprint
Use this when you need results without boiling the ocean:
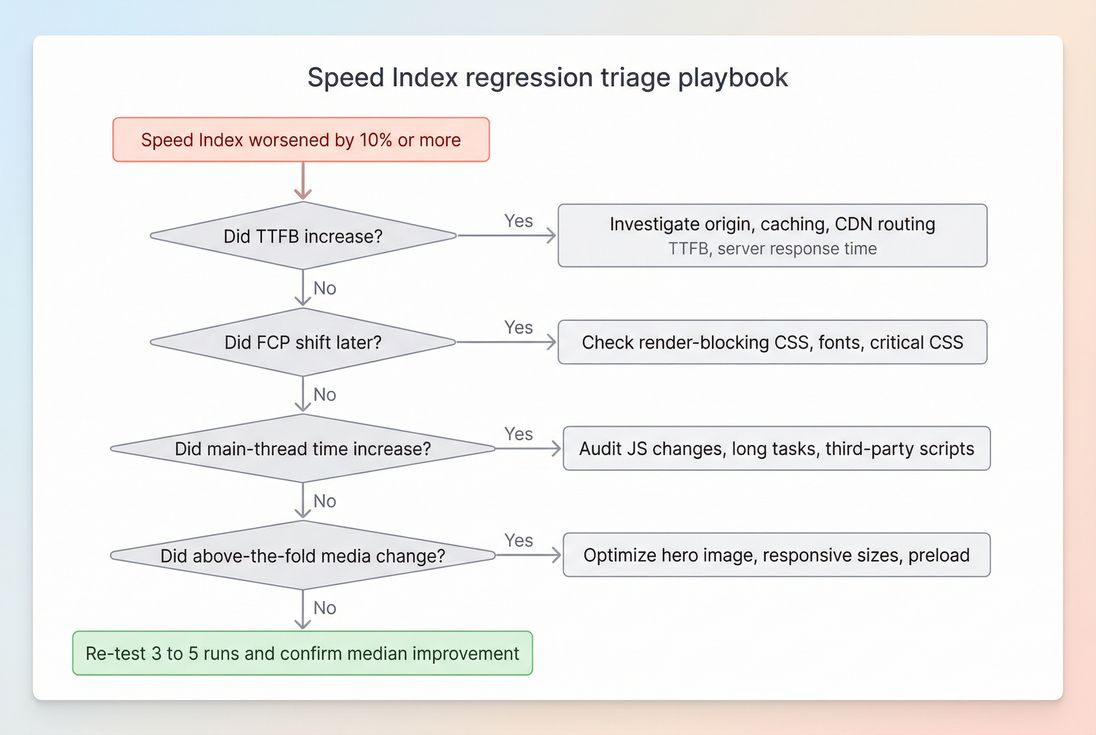
- Confirm regression is real (repeat runs, same settings).
- Check TTFB and server-side caching (Browser caching, Cache-Control headers).
- Remove render blockers (Render-blocking resources, Critical CSS, Unused CSS).
- Cut early JS cost (Unused JavaScript, Code splitting, Third-party scripts).
- Fix above-the-fold images (Image optimization, Responsive images, WebP vs AVIF).
- Re-test and document what moved (Speed Index + FCP + LCP + TBT/INP context).
If you want, share a Lighthouse report screenshot (filmstrip + timings). I can help you interpret what's driving your Speed Index and which fix is most likely to move it.
Frequently asked questions
As a rule of thumb in Lighthouse, aim for Speed Index under 3.4 seconds, treat 3.4 to 5.8 seconds as needs improvement, and above 5.8 seconds as poor. For e-commerce, prioritize category, product, and checkout pages. Faster visual load usually reduces bounce and improves add to cart rates.
LCP can be good even when the rest of the above the fold content renders slowly or in stages. Speed Index is sensitive to the whole visual progression: nav, hero text, layout, and images. Common causes include render blocking CSS, font delays, or heavy JavaScript that slows incremental painting.
Speed Index is not a Core Web Vital and is not used directly as a ranking signal. But it often correlates with real user perceptions and with metrics that do matter, like LCP and INP. Improving Speed Index tends to improve engagement signals, reduce bounces, and support conversions.
First confirm it is repeatable in lab tests, then check what changed: new hero media, new tags, CSS, fonts, or third-party scripts. Review the network waterfall and main thread work to find the new bottleneck. Treat a 10 to 20 percent increase as a meaningful regression.
They can. Speed Index measures visual completeness from video frames, so a fast painting placeholder can make the page look visually complete earlier than the real content. That can hide real delays in product images or data. Pair Speed Index with LCP and with usability checks to avoid false wins.
Want to take PageVitals for a spin?
Page speed monitoring and alerting for your website. Get daily Lighthouse reports for all your pages. No installation needed.
Start my free trial