Table of contents
Time to first byte (TTFB)
A slow Time to First Byte (TTFB) is the silent revenue killer: it delays everything that happens next – your first content, your hero image, and often your checkout. When TTFB creeps up, conversion rate and ad efficiency usually follow it down because users wait longer before they even see proof your site is working.
Time to First Byte (TTFB) is the time from when the browser starts requesting a page to when it receives the first byte of the response. In plain terms: how quickly your site begins to respond.
What TTFB actually measures
TTFB is a "front door" metric. It doesn't measure how fast the page renders – it measures how fast the browser gets the first response bytes back so rendering can begin.
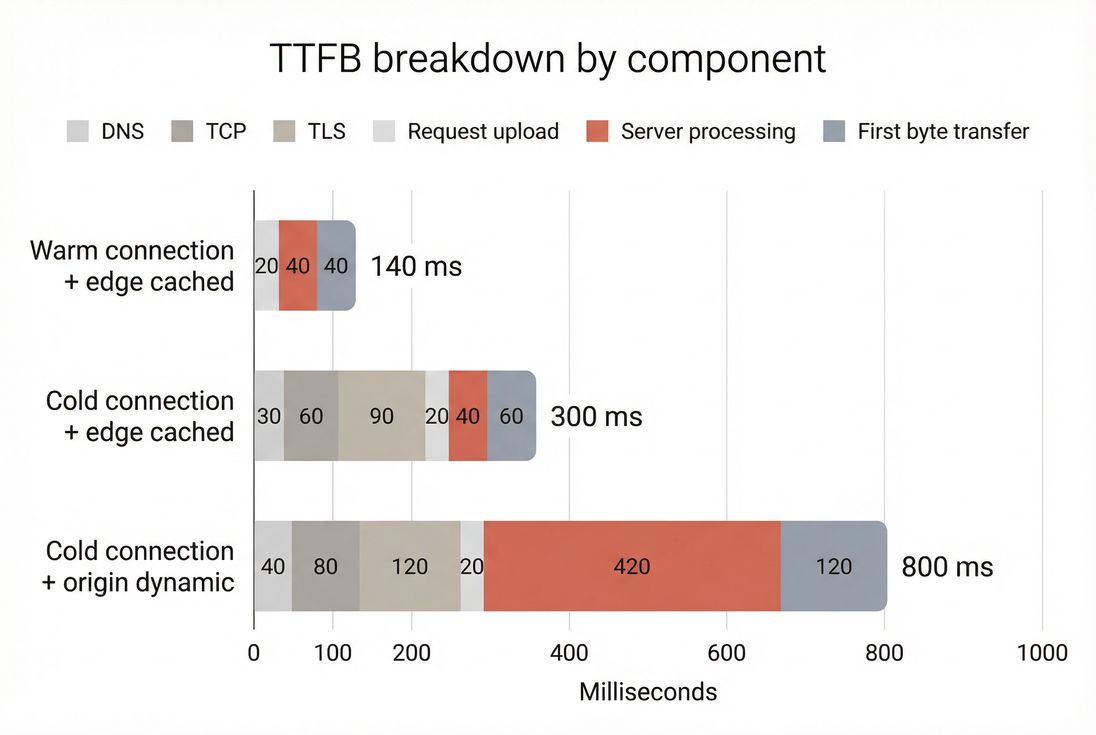
A practical way to think about TTFB is that it bundles several stages:
- Getting to the server: DNS lookup, establishing a connection (TCP), and negotiating security (TLS)
- Waiting for the server: application work, database queries, cache lookups, server-side rendering
- Getting the first bytes back: the initial response traveling over the network to the user
TTFB is closely related to, but not identical to, "server response time." If you want the concept-level distinction, see Server response time and Network latency.
What TTFB reveals for website owners
TTFB is most useful as a diagnostic signal. It helps you answer: "Is my site slow because the browser is busy rendering, or because the server is slow to respond?"
Here's how website owners typically use it in real decisions:
- CDN vs origin investment: If TTFB is driven by geography and connection setup, a CDN and connection reuse usually outperform backend refactors.
- Caching ROI: If server processing dominates TTFB, caching (edge or origin) often delivers the fastest improvement per engineering hour. See Edge caching and Browser caching.
- Infrastructure capacity planning: If TTFB rises during traffic peaks, your bottleneck is likely origin compute, database, or cache hit rate.
- Release safety: A sudden TTFB regression after a deploy often points to backend changes (new queries, heavier server-side rendering, third-party API calls).
The Website Owner's perspective
If TTFB is high, customers wait longer before seeing anything. That means fewer product views per session and higher paid click waste. If TTFB is unstable, you get "it feels slow" complaints that are hard to reproduce – until you correlate spikes with traffic, deploys, or cache misses.
What good TTFB looks like
"Good" depends on whether content is cached, where users are, and whether the connection is warm. Still, you need practical thresholds to make decisions.
Practical benchmarks
| TTFB (p75) | Interpretation | What it usually means |
|---|---|---|
| < 200 ms | Excellent | Edge cached, warm connections, healthy origin |
| 200–500 ms | Good | Typical for well-optimized sites with a CDN |
| 500–800 ms | Needs work | Either origin is doing heavy work or users are far from the server |
| > 800 ms | Poor | Customers will feel it; often a scaling or caching problem |
A few important notes when benchmarking:
- Cached vs dynamic: A fully edge-cached landing page should be far faster than a personalized account page.
- Mobile networks: Mobile radios and higher latency can inflate TTFB even when your origin is fast. This is why comparing Field vs lab data matters.
- p75 matters more than averages: Most user-facing reporting uses the 75th percentile (p75). If you only chase the average, you can miss the slow-user experience.
How it relates to Core Web Vitals
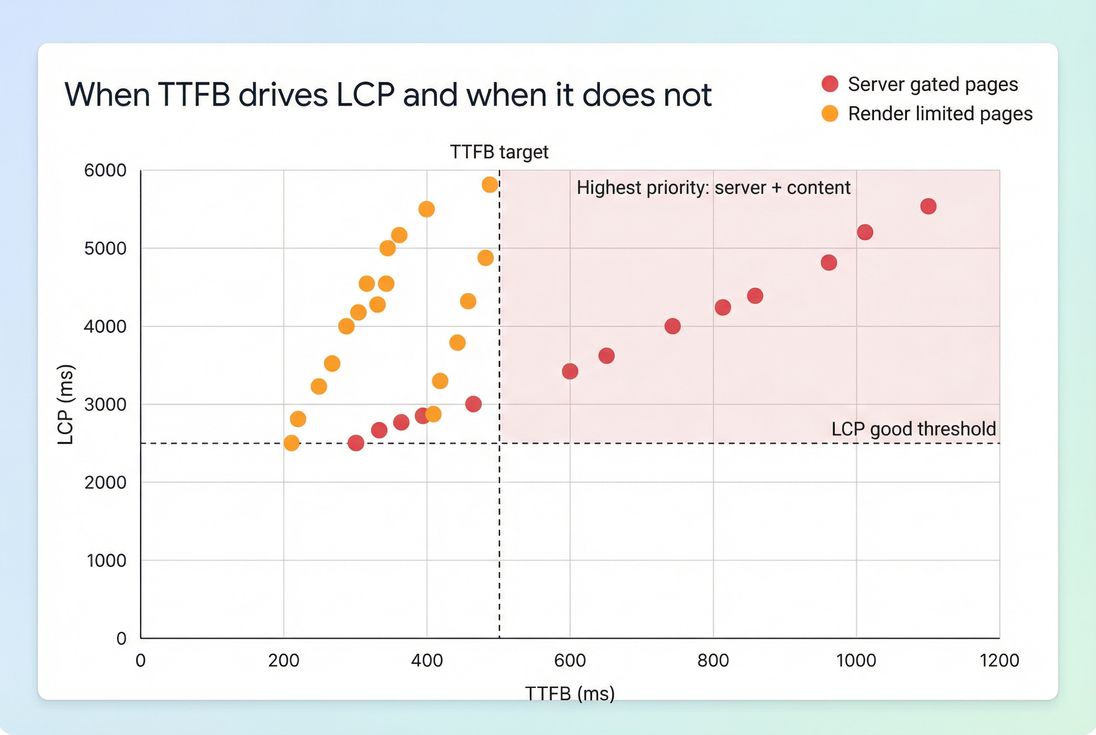
TTFB is not itself a Core Web Vital, but it often gates your ability to hit them:
- Faster TTFB helps FCP happen sooner (First Contentful Paint).
- Faster TTFB can help LCP – especially on server-rendered pages where the HTML unlocks the hero image discovery (Largest Contentful Paint).
- TTFB usually has little direct relationship to INP, which is more about main-thread work and event handling (Interaction to Next Paint).
What makes TTFB slow
When TTFB is high, the fix depends on which part is dominant: connection setup, distance, or server work.
Network and connection setup issues
If your users are far away or connections aren't reused, TTFB increases even if your server is fast:
- DNS lookup time (DNS lookup time)
- TCP handshake (TCP handshake)
- TLS handshake (TLS handshake)
- Connection reuse (Connection reuse)
- Protocol differences can matter (see HTTP/2 performance and HTTP/3 performance)
This pattern is common when:
- You have no CDN, or the CDN isn't actually serving HTML from the edge.
- You have many subdomains/third-party domains without connection reuse (sometimes mitigated by Preconnect or DNS prefetch).
Server processing issues (the usual culprit)
If TTFB is dominated by "waiting for the server," your origin is doing too much per request. Common causes:
- Cache misses (or short TTLs that force re-rendering)
- Slow database queries or lock contention
- Server-side rendering overhead (templates, personalization, feature flags)
- Third-party API calls in the request path (recommendations, inventory, fraud checks)
- Cold starts in serverless environments
If TTFB climbs only under load, suspect:
- saturated CPU
- database connection pool exhaustion
- cache stampedes during expiry windows
- noisy neighbors in shared hosting
CDN vs origin misunderstandings
Many teams "have a CDN" but still serve HTML from the origin. Then the CDN only accelerates static assets, while TTFB for the document remains slow.
To reason about this correctly, see CDN vs origin latency and CDN performance.
The Website Owner's perspective
If you're paying for a CDN and still seeing 700–1200 ms TTFB on key landing pages, you're likely not getting HTML edge caching. That's usually a configuration and cache-control problem – not a "we need a new platform" problem.
How to interpret TTFB changes
TTFB becomes actionable when you interpret changes in context – by geography, cache state, and time.
A simple interpretation checklist
When TTFB changes, ask these in order:
Did it change everywhere or only in some regions?
Region-specific changes usually point to CDN PoP issues, routing, or origin distance.Did it change only on some URLs/templates?
Template-specific spikes suggest backend logic or database queries tied to that page type.Did it change at specific times?
Time-based spikes suggest traffic-driven resource contention, cron jobs, cache expiry windows, or deploys.Did other metrics move with it?
- If TTFB rises and FCP/LCP rise similarly, the server is gating the whole experience.
- If TTFB improves but LCP doesn't, your bottleneck likely moved to rendering (see Critical rendering path and Render-blocking resources).
How to diagnose TTFB quickly
You'll move faster if you diagnose TTFB the same way every time: confirm it's real, isolate where it happens, then identify which component dominates.
Step 1: Use both lab and field views
- Lab tools (Lighthouse, synthetic) are great for repeatability and debugging.
- Field data shows what real customers experience across networks and devices.
If you use Chrome's public dataset for field trends, understand how it's aggregated via CrUX data.
Step 2: Inspect the request waterfall
A request waterfall tells you whether you're spending time on connection setup or waiting on the server.
- Long Stalled/Queueing can indicate connection limits or prioritization issues.
- Long DNS/TCP/TLS suggests connection setup overhead (or no reuse).
- Long Waiting (TTFB) suggests server processing or cache misses.
If you're using PageVitals, the most direct place to see this is the network request waterfall in the docs: Network request waterfall. For the metric definition as reported, see Time to First Byte.
Step 3: Segment by page type and cacheability
For an ecommerce site, separate at least:
- Home page (often cacheable)
- Category/listing pages (often cacheable with careful invalidation)
- Product pages (often cacheable; personalization should be minimized)
- Cart/checkout (often dynamic; prioritize stable backend performance)
TTFB that's "fine on the homepage, terrible on product pages" usually indicates template or backend issues, not a network problem.
Step 4: Compare edge vs origin behavior
To identify whether your CDN is helping:
- Compare TTFB from multiple regions.
- Check response headers for cache status (HIT/MISS) and cache-control logic.
If you find you're frequently revalidating or bypassing caches, revisit Cache-Control headers and Cache TTL.
How to improve TTFB without breaking things
TTFB fixes fall into two buckets: reduce server work and reduce network overhead. The highest ROI usually comes from caching and eliminating avoidable backend work.
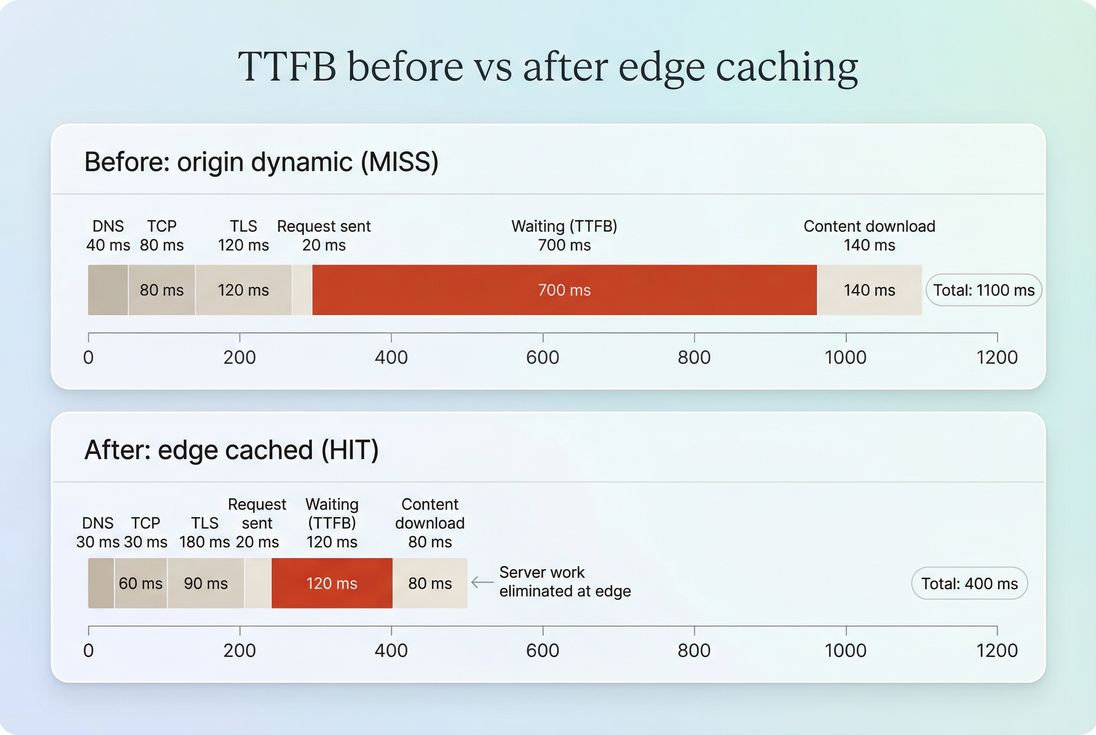
1) Make HTML cacheable (where possible)
For many businesses, the single biggest TTFB win is caching the HTML document – especially for landing, category, and product pages.
Focus areas:
- Add correct Cache-Control directives (Cache-Control headers)
- Use edge caching for globally distributed users (Edge caching)
- Prevent cache fragmentation from unnecessary cookies, query strings, or headers
- Avoid "cache stampedes" by using stale-while-revalidate patterns (where supported)
The Website Owner's perspective
If your paid landing pages aren't cacheable, you pay twice: once for the click, and again in lost conversion from slower first paint. Making just your top landing pages edge-cacheable can outperform weeks of front-end micro-optimizations.
2) Reduce backend work on cache misses
When a request does hit the origin, you want the origin path to be short and predictable:
- Remove or defer expensive server-side personalization
- Eliminate redundant database queries
- Add application-level caching for computed fragments
- Avoid third-party calls in the critical request path (or set strict timeouts)
This is where "TTFB regressions after deploy" usually come from: new synchronous work added to the request path.
3) Cut connection setup overhead
This helps most for first-time visitors and cross-domain navigations:
- Ensure keep-alive and connection reuse are working (Connection reuse)
- Prefer modern protocols where supported (HTTP/2 performance, HTTP/3 performance)
- Use Preconnect and DNS prefetch selectively (don't spam them)
4) Compress responses sensibly
Compression won't fix server compute, but it can reduce the time to deliver the first bytes – especially on slower connections.
- Brotli compression (best for text when supported)
- Gzip compression (fallback)
5) Don't confuse TTFB with front-end bottlenecks
It's common to "win" TTFB and still lose performance because rendering is blocked.
If TTFB is already good (<500 ms) but LCP is poor, shift to:
- Critical CSS and Unused CSS
- Asset minification
- Async vs defer
- JavaScript execution time and Reduce main thread work
- Image optimization and Responsive images
- Font loading
- Above-the-fold optimization
A practical TTFB playbook for ecommerce
If you need a simple priority order, use this:
Protect cache hit rate on top pages
Make sure your highest-traffic landing, category, and product pages can be served quickly and consistently.Set a TTFB target and watch p75
For most ecommerce sites, p75 under 500 ms is a strong baseline; under 200 ms for edge-cached pages is achievable.Investigate spikes, not just slow averages
Spikes correlate with outages, campaign waste, and "the site feels broken" user reports.Only then tune the front-end
Once TTFB is stable and reasonable, move effort into the rendering path (LCP, INP), where front-end work delivers clear returns.
If you want a broader view of how this fits with the rest of the performance picture, start with Web performance metrics and Core Web Vitals.
Frequently asked questions
Aim for under 200 ms for cached pages at the edge and under 500 ms for most real users. If you are consistently above 800 ms, users will feel the site is slow even before anything renders. Use a CDN and aggressive caching to keep product and category pages fast.
Not always. TTFB is the first gate, but LCP can still be dominated by render blocking CSS, heavy JavaScript execution, large images, or slow font loading. Treat TTFB as the server and network head start. Then optimize the rendering path to turn that head start into faster LCP.
Lab tests often run from a limited set of locations with stable networks and warm caches. Real users have variable latency, slower radios, different geographies, and may miss caches. Compare lab with field data and segment by country and device to identify whether the problem is origin load or network distance.
Use a CDN when users are geographically far from your origin or when caching can eliminate backend work for repeatable pages. Edge caching reduces both network latency and server processing time. It is often the fastest win for ecommerce category, product, and landing pages with predictable content.
Spikes typically come from origin overload, database contention, cache stampedes, slow third party calls during server rendering, or misconfigured caching headers that force revalidation. During campaigns, monitor TTFB alongside error rates and origin CPU. Prioritize protecting cache hit rate and shedding expensive backend work.
Want to take PageVitals for a spin?
Page speed monitoring and alerting for your website. Get daily Lighthouse reports for all your pages. No installation needed.
Start my free trial