Table of contents
Web performance metrics overview
Fast sites don't just "feel better" – they waste less ad spend, lose fewer shoppers to impatience, and reduce support issues caused by broken interactions (rage clicks, mis-taps, layout jumps). The problem is that "page speed" is not one thing. It's a set of measurements that describe different parts of the user experience.
Web performance metrics are the standardized timestamps, durations, and stability signals collected by browsers (and testing tools) that quantify how quickly content appears, how soon the page responds to input, and how stable the layout remains while loading.
Below is a practical overview of the metrics that matter, how they're produced, and how to use them to make real prioritization decisions.
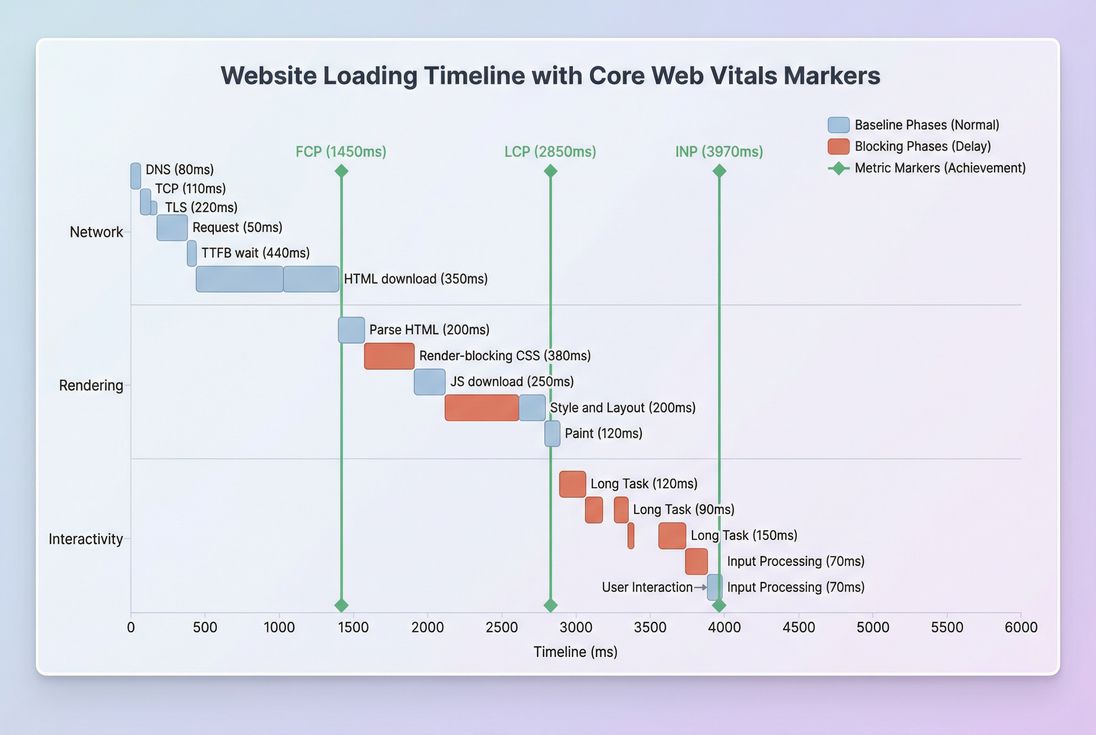
*How the major metrics map to real loading phases: network work influences TTFB; rendering influences FCP and LCP; JavaScript and long tasks influence INP.*
What these metrics really measure
Website owners usually want answers to five questions:
- Did the page show something fast enough? (loading)
- Did it become usable quickly? (responsiveness)
- Did it behave predictably while loading? (stability)
- Where is the time going – server, network, or browser? (diagnosis)
- Will changes in a tool reflect real customer experience? (measurement quality)
That's why modern performance work starts with Core Web Vitals – they are designed to represent user-perceived experience, not just raw technical events.
The Website Owner's perspective: A single "load time" number doesn't tell you what to fix. You need loading, responsiveness, and stability separated so you can assign work to the right team (backend, frontend, marketing tags, platform) and predict business impact.
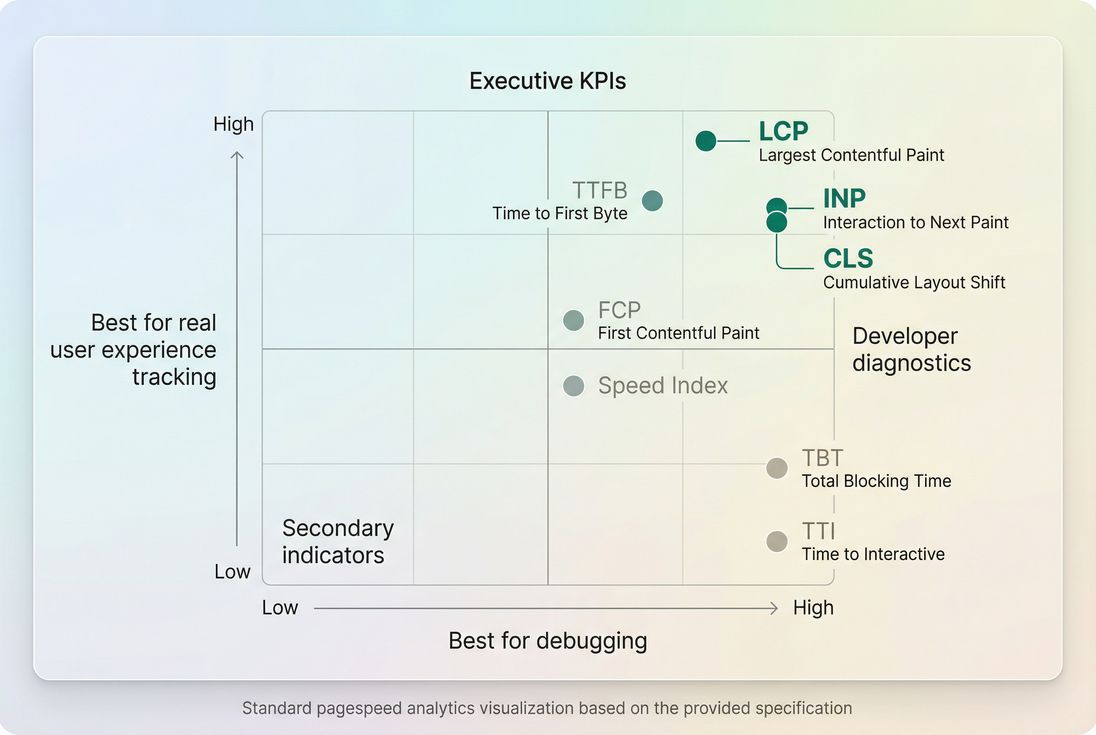
Which metrics deserve executive focus
If you only track a handful of metrics, make them outcome metrics that correlate with user experience and (often) SEO performance.
Core Web Vitals (outcomes)
These three are the primary "north star" metrics:
- LCP (Largest Contentful Paint): when the main content likely becomes visible.
- INP (Interaction to Next Paint): how quickly the UI responds after a user action.
- CLS (Cumulative Layout Shift): how much the layout shifts unexpectedly.
How to interpret them: these should be evaluated primarily using field data (real users) at the 75th percentile (p75). That's the industry standard for Core Web Vitals reporting because it reflects what a "typical slower user" experiences – not just your best-case sessions.
| Metric | What users feel | Good target (field p75) | Common business symptom when bad |
|---|---|---|---|
| LCP | "Did the page load?" | ≤ 2.5s | higher bounce, lower product discovery |
| INP | "Is it responsive?" | ≤ 200ms | rage clicks, form drop-offs, add-to-cart friction |
| CLS | "Is it stable?" | ≤ 0.1 | mis-clicks, reduced trust, checkout errors |
For deeper measurement details, see Measuring Web Vitals and the difference between Field vs lab data.
Supporting metrics (diagnostics)
Supporting metrics help you pinpoint why Core Web Vitals are poor.
Common ones to keep on your dashboard:
- TTFB: time until the first byte of the response arrives (server + network + caching behavior).
- FCP: when the first text/image is painted (early feedback to users).
- Speed Index: how quickly the visible area fills in over time.
- Total blocking time and Long tasks: lab-friendly signals of main-thread blockage (often tied to INP).
- Page load time: useful for historical comparisons, but too broad to diagnose alone.
A practical way to think about this:
- Use Core Web Vitals to judge experience.
- Use supporting metrics to find the bottleneck.
How the numbers are produced
Most web performance metrics are derived from browser APIs that record timestamps and events during navigation and interaction.
Field vs lab collection
- Field (RUM) metrics come from real users on real devices and networks. They include variability from geographies, user logins, A/B tests, and third-party scripts.
- Lab (synthetic) metrics come from a controlled test: fixed device, throttled CPU/network, clean cache. They're excellent for debugging and before/after verification.
If you're using PageVitals, the product documentation explains how this is represented across testing types in Synthetic vs field testing.
Why percentiles matter more than averages
Averages hide pain. One slow backend spike, one heavy personalization variant, or one third-party tag can ruin a meaningful slice of sessions while barely moving the average.
Core Web Vitals commonly use p75:
- 75% of visits are faster/better than this number
- 25% of visits are worse than this number
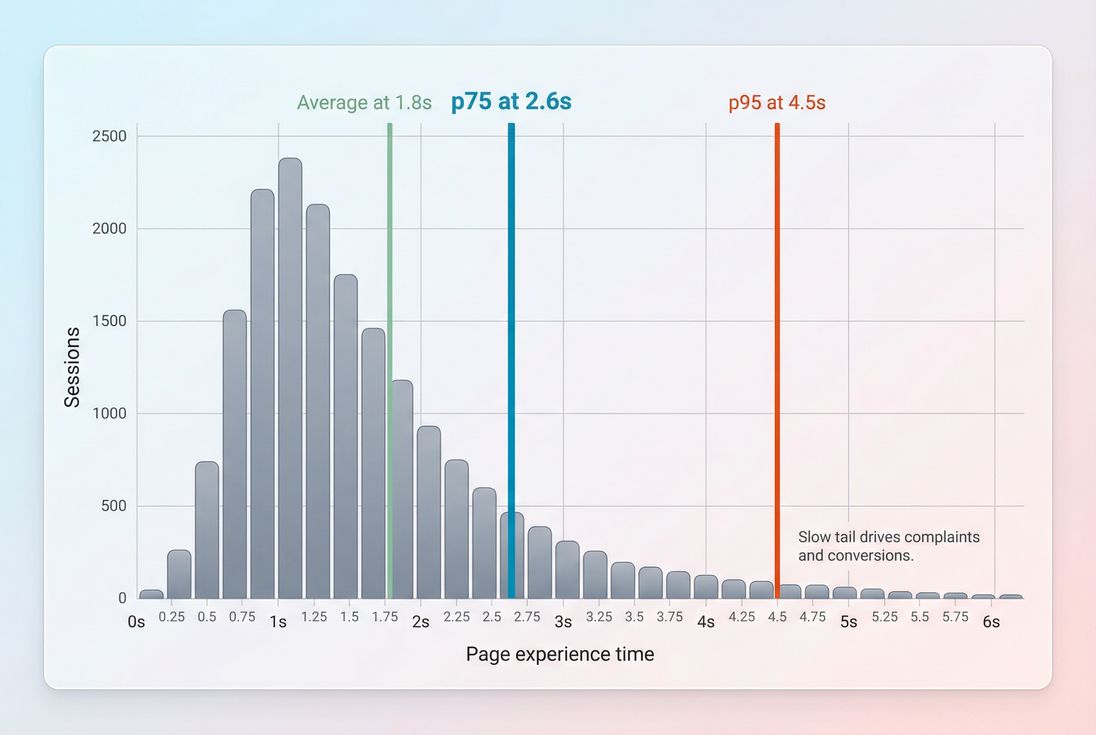
*Percentiles expose the slow tail that harms conversions; averages often stay flat even when many users are having a bad experience.*
The Website Owner's perspective: When p75 improves, you're usually improving the experience for a large chunk of paying customers. When only the average improves, it might just mean your best users got even better – while the slow tail (often mobile) still struggles.
How key metrics are determined (plain English)
TTFB: measured from navigation start until the browser receives the first byte of the response. It's affected by backend processing, caching, routing, and connection setup (DNS/TCP/TLS).
- Learn more: Server response time, DNS lookup time, TCP handshake, TLS handshake, CDN vs origin latency.
FCP: the first time the browser paints any content from the DOM. It's strongly influenced by render-blocking CSS/JS and font behavior.
- Learn more: Render-blocking resources, Critical CSS, Font loading.
LCP: the render time of the largest visible image or text block in the viewport. It typically depends on:
- Server delivery (often seen in TTFB)
- Resource load (images, fonts, CSS)
- Rendering delay (main-thread work before painting)
- Learn more: Above-the-fold optimization, Image optimization, Responsive images, Lazy loading.
CLS: sums unexpected layout shifts (for example, an ad slot pushes your "Add to cart" button down). Often caused by images without dimensions, injected elements, and font swaps.
- Learn more: Layout instability, Zero layout shift.
INP: looks at user interactions and measures the delay from the interaction until the next paint reflecting that interaction. This is heavily influenced by JavaScript execution, long tasks, and third-party scripts.
What usually drives changes (and regressions)
When owners see a regression, the fastest path is to map the kind of regression to likely causes.
If LCP worsens
Common real-world causes:
- Heavier hero images (bigger file, no responsive sizing, wrong format)
- Fixes: Image compression, WebP vs AVIF, Responsive images.
- More render-blocking work (CSS or JS loaded earlier)
- Slower delivery (TTFB spike due to backend, cache misses, deploy)
If INP worsens
Typical causes:
- New JavaScript shipped to all users (A/B testing frameworks, personalization, analytics)
- More main-thread work per view (hydration, complex client-side rendering, heavy frameworks)
- Third-party scripts doing work during interaction (chat widgets, tag managers, review plugins)
Where to look next:
If CLS worsens
Common culprits:
- Promotional banners inserted after load
- Ads/responsive embeds without reserved space
- Late-loading fonts causing text reflow
Where to look next:
The Website Owner's perspective: Most "mystery regressions" are not mysteries. They're usually one of: a bigger hero image, a new tag, a cache change, or a new script execution path. When you connect the regressed metric to its usual causes, you can route the issue to the right owner in minutes.
How to interpret changes without fooling yourself
A metric moving is not the same as user impact. Here's a practical interpretation framework.
Separate "real" shifts from noise
Expect normal day-to-day variance due to traffic mix, campaigns, and device/network differences. To treat a change as meaningful, look for:
- The change persists for multiple days (not one spike)
- It affects multiple key templates (not one edge URL)
- It shows up in both field and lab (field confirms impact, lab helps debug)
For field data sources, understand sample sizes and segmentation – especially if you use CrUX data.
Watch for trade-offs
Some improvements can backfire:
- Aggressive lazy loading can improve initial bytes but delay the LCP element if misapplied (Lazy loading).
- Shipping less CSS can help FCP but cause late layout shifts if placeholders are wrong (Unused CSS).
- Adding third-party "conversion boosters" can reduce actual conversions if INP degrades.
Tie metrics to business funnels
A clean way to do this for e-commerce is by template:
- Home / landing pages: LCP + CLS (first impression and trust)
- Category (PLP): INP (filters, sorting), CLS (product tiles jumping)
- Product (PDP): LCP (hero media), INP (variant selectors), CLS (reviews/inventory widgets)
- Checkout: INP + CLS (form usability) and TTFB (backend calls)
How website owners use metrics to prioritize work
Metrics become operationally useful when they answer: "What should we do next?"
Use a simple priority ladder
- Fix stability and interactivity issues on revenue pages first
- Bad CLS and INP often create direct usability failures.
- Then fix LCP on the highest-traffic entry pages
- This reduces bounce and improves product discovery.
- Then improve TTFB and caching to make gains cheaper
- Faster delivery multiplies improvements across templates.
Map fixes to teams (so work actually happens)
| Symptom | Most likely owner | Where to start |
|---|---|---|
| High TTFB | Backend / platform / hosting | Server response time, Edge caching, Connection reuse |
| LCP slow but TTFB ok | Frontend | Above-the-fold optimization, Critical CSS, Image optimization |
| INP slow | Frontend + marketing ops | Reduce main thread work, Third-party scripts |
| CLS high | Frontend + ads/content | Layout instability, Zero layout shift |
Establish budgets that prevent regressions
Performance budgets work when they are:
- Template-based (home vs PDP vs checkout)
- Outcome-based (p75 LCP/INP/CLS targets)
- Guardrail-based (bundle size, request count, image weight)
If you use PageVitals, the docs explain how to configure budgets and enforce them in workflows: Performance budgets.
*Use field data to judge experience and lab data to debug – most teams need both, but for different decisions.*
Where to view and drill into metrics
If you're trying to connect "the metric moved" to "what changed," you need two things: (1) the metric trend and segmentation, and (2) a way to inspect underlying causes.
In PageVitals documentation, these are covered in:
- Metric definitions and reporting: /docs/metrics/
- Field Web Vitals reporting: /docs/features/field-testing/web-vitals/
- Waterfall analysis for lab tests: /docs/features/network-request-waterfall/
Practical takeaway
If you want a performance program that improves revenue outcomes (not just scores), run it like this:
- Track Core Web Vitals (p75 field) as your experience KPIs.
- Keep TTFB + lab diagnostics on hand to quickly locate bottlenecks.
- Interpret changes with percentiles and segmentation, not averages.
- Prioritize fixes by template impact (PDP/checkout first), then by root cause (server vs frontend vs third-party).
- Add performance budgets so wins don't disappear next sprint.
For deeper drills into specific bottlenecks, start with Critical rendering path, Render-blocking resources, and Third-party scripts.
Frequently asked questions
Track Core Web Vitals at the 75th percentile: LCP for loading, INP for responsiveness, and CLS for visual stability. Pair them with TTFB (server and CDN health) and a lab dashboard (Lighthouse) for fast debugging. Weekly tracking catches regressions before they hit conversion rate and paid traffic ROI.
Use Core Web Vitals thresholds: LCP at or below 2.5 seconds, INP at or below 200 milliseconds, and CLS at or below 0.1, measured at the 75th percentile in field data. For supporting metrics, keep TTFB under about 0.8 seconds and avoid long main-thread tasks that create interaction lag.
Lighthouse is lab data from a controlled device and network, so it may miss real-world issues like slow geographies, third-party tags, or personalized content. Also, improving a "score" might not change LCP, INP, or CLS for real users. Validate progress using field data and segment by page type and device.
Start with TTFB. If TTFB spikes, look at origin load, caching, CDN routing, and backend changes. If TTFB is stable but LCP worsens, it's often render-blocking CSS, image size, font loading, or client-side rendering. If INP worsens, suspect heavy JavaScript, long tasks, or third-party scripts.
Budget outcomes and inputs: set p75 targets for LCP, INP, and CLS, then add guardrails like JavaScript bundle size, number of requests, and image weight for key templates. Tie budgets to release checks (CI) and alerting. Budgets work best when they're template-based (home, PLP, PDP, checkout) and enforced consistently.
Want to take PageVitals for a spin?
Page speed monitoring and alerting for your website. Get daily Lighthouse reports for all your pages. No installation needed.
Start my free trial