Table of contents
Measuring core web vitals
A Core Web Vitals "pass" rarely makes a business, but a Core Web Vitals "fail" can quietly tax everything: paid traffic efficiency, SEO growth, conversion rate, and even support load (because frustrated users abandon or retry actions). The hard part isn't knowing the names of the metrics – it's measuring them in a way that leads to confident decisions.
Measuring Core Web Vitals means collecting reliable data for LCP, INP, and CLS (the three metrics in the Core Web Vitals set), then interpreting that data correctly – especially the 75th percentile values Google emphasizes – so you can prioritize fixes that measurably improve real user experience.
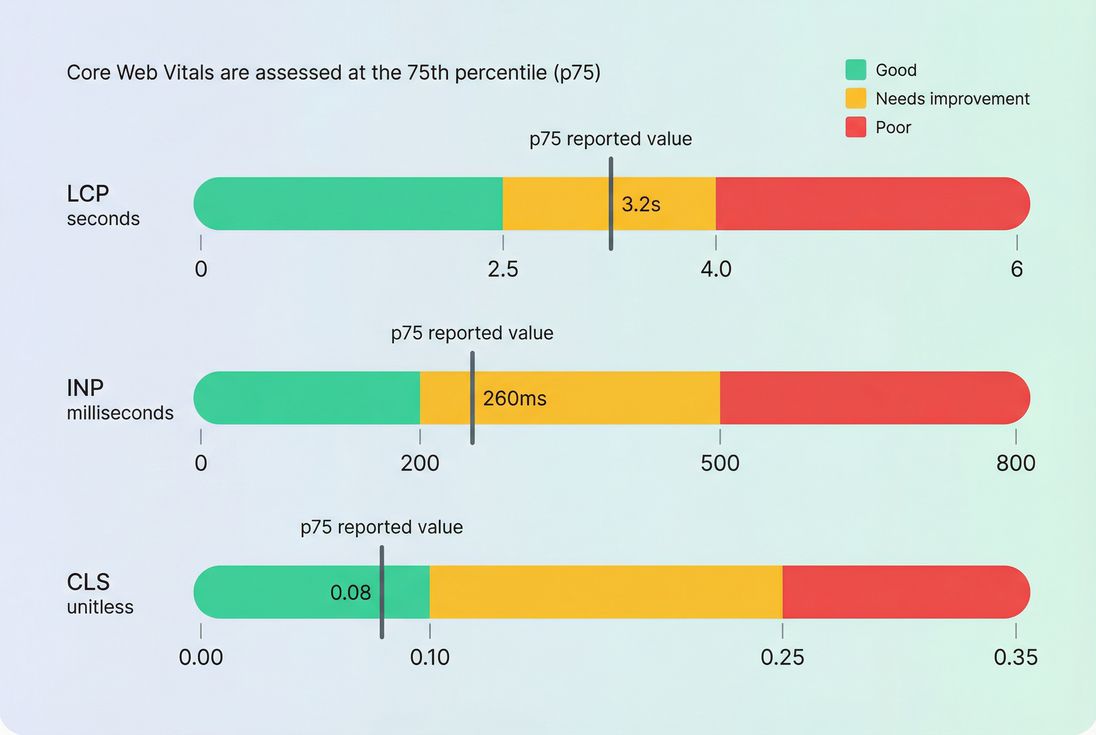
Core Web Vitals are judged against fixed thresholds, and the value that matters most for assessment is typically the 75th percentile (p75), not the average.
What measuring CWV really means
Core Web Vitals are three user-centric metrics:
- LCP (Largest Contentful Paint): how long it takes for the main content to appear.
- INP (Interaction to Next Paint): how quickly the page responds visually after a user interaction (tap, click, keypress).
- CLS (Cumulative Layout Shift): how much the page layout shifts unexpectedly while loading.
When website owners say "we improved Core Web Vitals," what they should mean is:
- The p75 (75th percentile) values moved into a better bucket (good/needs improvement/poor).
- The change holds across the templates that matter (product, category, cart, checkout).
- The improvement happened for real users, not just in a single lab test.
The Website Owner's perspective: You don't need perfect scores everywhere. You need to stop losing revenue on your highest-traffic, highest-intent pages because they feel slow, laggy, or unstable – especially on mid-tier mobile devices.
Which data should you trust
Most Core Web Vitals confusion comes from mixing field and lab measurements.
Field data (what users experienced)
Field data is what real users experienced in real conditions. It's the best input for prioritization because it reflects:
- real devices and CPUs (including low-end phones)
- real networks and latency
- real cache states (warm/cold)
- real third-party script behavior
- real UI behavior after user interactions
Two common field sources:
- CrUX (CrUX data): Google's aggregated Chrome user data. Great for "how are we doing overall," but it's aggregated and not always granular enough for debugging.
- RUM (Real user monitoring): your own per-visit measurement, usually segmentable by page template, device, geography, and release.
Lab data (why it happened)
Lab data runs in a controlled environment (e.g., Lighthouse) and is best for debugging because it gives you:
- repeatability
- waterfalls and traces
- direct visibility into the critical rendering path
- controlled device/network profiles for comparisons
The most common lab workflow entry point is PageSpeed Insights, which combines a Lighthouse run with a snapshot of field data when available.
A practical rule
- Use field to answer: Where are we losing users, and for whom?
- Use lab to answer: What exactly should engineering change to fix it?
If you want to go deeper on this distinction, see Field vs lab data.
How the reported number is built
Percentiles beat averages
Core Web Vitals are typically evaluated using the 75th percentile (p75). That matters because performance problems usually hurt a "tail" of users:
- slower devices
- worse networks
- heavier pages (personalization, experiments)
- third-party scripts firing unpredictably
Averages hide those users. p75 exposes them.
What p75 means in practice
If your LCP p75 is 3.2s, that means:
- 75% of visits had LCP at or below 3.2s
- 25% of visits had LCP worse than 3.2s
This is why teams often celebrate "median improvements" and still fail Core Web Vitals: the tail is still bad.
Page, template, and origin aggregation
You'll see Core Web Vitals reported at different levels:
- URL-level: one specific page.
- Template-level: product pages as a group, category pages as a group, etc. (often the most useful for action).
- Origin-level: your whole site (what many external reports emphasize).
For business decisions, template-level is usually the sweet spot: it's stable enough to trend, but actionable enough to fix without chasing one-off pages.
Metric-specific quirks
- INP is influenced by the worst (or near-worst) interactions on a page visit, not an average of all interactions. A single heavy handler on "Add to cart" can dominate the user's experience.
- CLS is not "total movement," it's unexpected movement that happens without user intent. Late-loading banners, font swaps, and image slots without dimensions are classic causes.
- LCP depends on both server and front-end behavior; improving TTFB often unlocks LCP improvements when everything else is already "pretty good."
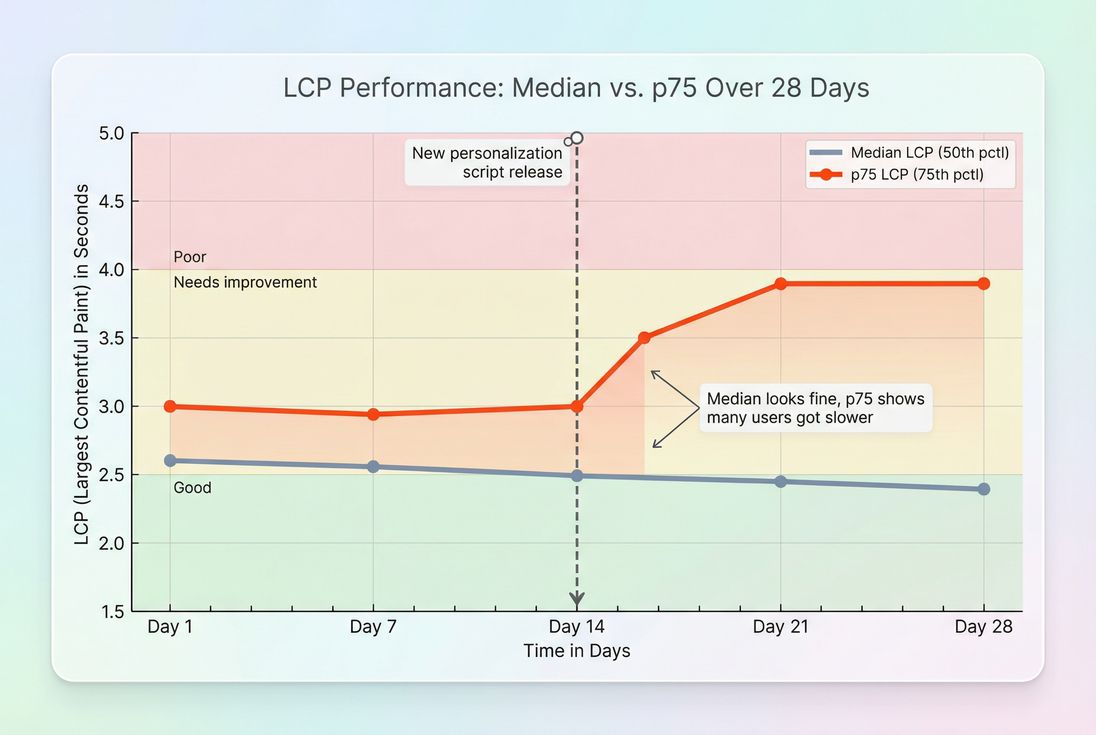
Median metrics can improve while p75 gets worse – exactly the scenario that causes "we optimized" claims but continued Core Web Vitals failures.
What drives each vital
This is where measurement becomes operational: each metric has a different "physics," so it needs a different debugging approach.
LCP drivers
LCP is usually held back by some combination of:
- Slow server response: high server response time and poor TTFB.
- Network setup costs: DNS/TCP/TLS overhead (DNS lookup time, TCP handshake, TLS handshake).
- Render-blocking resources: CSS and JS that delay first paint (render-blocking resources, critical CSS).
- Heavy LCP element: oversized images, wrong formats, missing responsive sizing (image optimization, WebP vs AVIF, responsive images).
- Font delays: late font loading impacts above-the-fold rendering (font loading).
If your LCP is failing, it's rarely solved by "micro-optimizations." It's typically solved by:
- improving TTFB with caching and infrastructure (browser caching, Cache-Control headers, edge caching, CDN vs origin latency)
- reducing render-blocking and critical path work (critical rendering path)
- making the hero content cheap to load and quick to paint (above-the-fold optimization)
INP drivers
INP is about responsiveness under real interaction load. It degrades when the main thread is busy:
- too much JavaScript work (JS execution time, reduce main thread work)
- long tasks monopolizing the thread (long tasks)
- big bundles and slow parsing (JS bundle size, unused JavaScript)
- third-party scripts competing for time (third-party scripts)
Common "INP surprise": A site "loads fast" (good LCP), but feels janky when users filter products, open drawers, apply coupons, or add to cart.
In lab tools, Total Blocking Time (Total blocking time) is often used as a debugging proxy because it highlights long tasks – just remember it's not the same as INP.
CLS drivers
CLS increases when the page changes layout unexpectedly:
- images without width/height or aspect-ratio reserved
- ads/widgets injected above existing content
- cookie banners that push content (especially late)
- late-loading fonts causing text reflow (font loading)
- UI that expands after hydration on SPAs
If CLS is your main failure, you usually win by tightening layout discipline:
- reserve space for media and embeds
- avoid inserting content above what the user is reading
- use patterns aligned with zero layout shift and layout instability
How website owners interpret changes
"Metric changed" isn't enough. You need to know what kind of change it is and what decision it supports.
Use this interpretation table
| What you see | What it often means | What to do next |
|---|---|---|
| p75 worsens, median stable | Tail users got slower (device mix, third-party, cache misses) | Segment field data by device/network; reproduce with throttled lab runs |
| LCP worsens sitewide | TTFB/caching/CDN regression or new render-blocking | Check TTFB, caching headers, recent releases, CDN/origin |
| INP worsens on product pages only | Heavy "Add to cart"/variant picker code, third-party, hydration | Profile main-thread work; reduce JS; audit third parties |
| CLS worsens after marketing changes | New banners, promos, injected widgets | Reserve space; change insertion rules; test with consent/banner states |
| Lab improves, field doesn't | Fix didn't reach users (A/B split, cache, rollout) or lab isn't representative | Validate release coverage, caching, user segmentation |
The Website Owner's perspective: Treat Core Web Vitals like revenue operations, not a one-time project. When p75 gets worse, some customers are having a meaningfully worse experience right now. Your job is to find which pages and which users are paying that tax – and stop it.
Segmenting is where teams level up
The fastest way to get "unstuck" is to stop looking at one global number. Segment by:
- template (product vs category vs checkout)
- device class (mobile vs desktop)
- geography (latency differences)
- navigation type (landing vs internal navigation; see also prefetch and preload impacts)
This is also how you avoid wasted engineering time: if checkout is already good but category pages are poor on mobile, you now have a clear, revenue-aligned target.
How to measure in practice
A reliable program uses both field and lab, on purpose.
Step 1: pick the pages that matter
Start with your money pages:
- product detail pages
- category/listing pages
- cart and checkout steps
- top landing pages from paid campaigns
Then group them by template so you can fix issues once and benefit everywhere.
Step 2: establish a baseline
Your baseline should include:
- p75 for LCP/INP/CLS
- a trend view (week-over-week)
- notes on major releases, promotions, and third-party changes
If you only keep screenshots of PageSpeed Insights runs, you'll miss real-world variance and tail issues.
Step 3: use lab tests to debug
Once field data tells you "product pages on mobile are failing INP," lab tools help you answer "why."
Common lab tactics:
- audit render-blocking and critical CSS (critical CSS, asset minification)
- reduce JS work and long tasks (code splitting, unused CSS, unused JavaScript)
- optimize images and delivery (image compression, lazy loading)
- validate caching and compression (Brotli compression, Gzip compression)
Step 4: confirm fixes in the real world
This is where many teams fail: they "fix" lab scores and ship, but don't confirm field movement at p75.
Field confirmation requires:
- enough traffic volume to make trends stable
- clean segmentation (template/device)
- patience for aggregation windows (especially if relying on CrUX-style rollups)
Step 5: prevent regressions
Regressions are more expensive than improvements. The operational goal is: catch problems before they hit customers.
That usually looks like:
- performance budgets for key metrics
- automated synthetic tests in CI
- alerting on meaningful p75 shifts
If you're using PageVitals, the relevant documentation entry points are:
- Web Vitals field testing reports: /docs/features/field-testing/web-vitals/ (and per-metric views like LCP report, INP report, CLS report)
- Budgets: https://pagevitals.com/docs/features/budgets/
- CI/CD automation (example): https://pagevitals.com/docs/ci-cd/github-action/
- Test consistency controls: https://pagevitals.com/docs/features/test-agent-settings/
Common measurement mistakes
Only using Lighthouse
Lighthouse is essential for debugging, but it's not a performance monitoring strategy. Treat it like a diagnostic scan, not a customer experience ledger.
Testing with unrealistic states
Cookie consent banners, geolocation popups, and A/B scripts can materially change CLS and INP.
If you run lab tests, control those variables. For PageVitals Lighthouse testing, this guide is directly relevant: https://pagevitals.com/docs/guides/removing-cookie-consent-banners-from-your-lighthouse-tests/
Ignoring third-party changes
Many regressions come from tags: analytics, personalization, chat, reviews, affiliate pixels. Track them like code: version changes, load conditions, and impact on main-thread work.
Not aligning to business funnels
Improving a blog template while checkout is failing is a classic misallocation. Tie measurement to business journeys (landing → category → product → cart → checkout), especially on mobile.
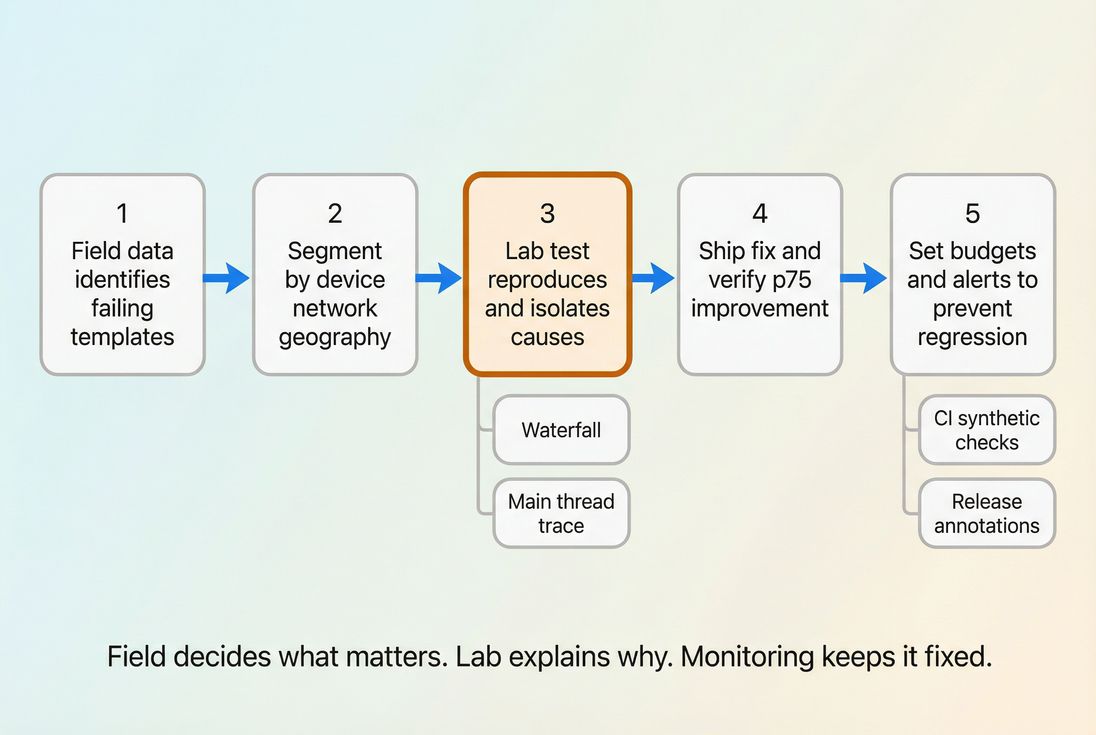
A practical Core Web Vitals program is a loop: field data tells you where it hurts, lab data tells you why, and budgets/alerts keep wins from rolling back.
A simple decision framework
When you look at Core Web Vitals, aim to answer these four questions in order:
- Where is the revenue risk? (Which templates and devices?)
- Which metric is failing? (LCP vs INP vs CLS)
- Is it a tail problem or a global problem? (p75 vs median divergence)
- What change will move p75? (Caching/TTFB, render-blocking, JS long tasks, layout discipline)
That's how Core Web Vitals measurement becomes a decision tool – not just a scorecard.
Frequently asked questions
Report the 75th percentile for LCP, INP, and CLS for your most important templates (home, category, product, cart, checkout). That is what Google uses for Core Web Vitals assessment. Pair it with a trend line and conversion rate context so improvements translate into business impact.
Lighthouse is a controlled lab test on a single device and network profile, so it is best for debugging. Field data aggregates many real devices, networks, and behaviors, so it is best for deciding what actually hurts customers. Disagreement usually means device mix, caching, or third parties vary in the real world.
Use Google's thresholds at the 75th percentile: LCP good is 2.5 seconds or less, INP good is 200 milliseconds or less, and CLS good is 0.1 or less. For an origin or template to pass, aim for at least 75 percent of visits in the good bucket.
If you have RUM, act as soon as you see a stable trend with enough traffic per template to avoid random noise, often a few days for larger sites. For CrUX style reporting, expect a rolling multi-week window. For urgent regressions, use synthetic tests to confirm immediately.
Start where revenue is made and where the metric is clearly failing: product and checkout templates, then category pages. For LCP, prioritize TTFB and above-the-fold rendering. For INP, reduce long tasks and third-party impact. For CLS, eliminate layout shifts from images, ads, and late-loading UI.
Want to take PageVitals for a spin?
Page speed monitoring and alerting for your website. Get daily Lighthouse reports for all your pages. No installation needed.
Start my free trial