New RUM breakdown reports and advanced filtering

We're excited to announce major updates to the Field Testing / Real User Monitoring (RUM) section of our web performance tool. With these new features, you'll have even deeper insights into how your users experience your site in the wild. From filtering data to drilling down into individual performance metrics, debugging has never been easier.
🖥 Detailed Breakdown of LCP, INP, and TTFB
One of the most powerful additions in this release is the detailed breakdown of key performance metrics:
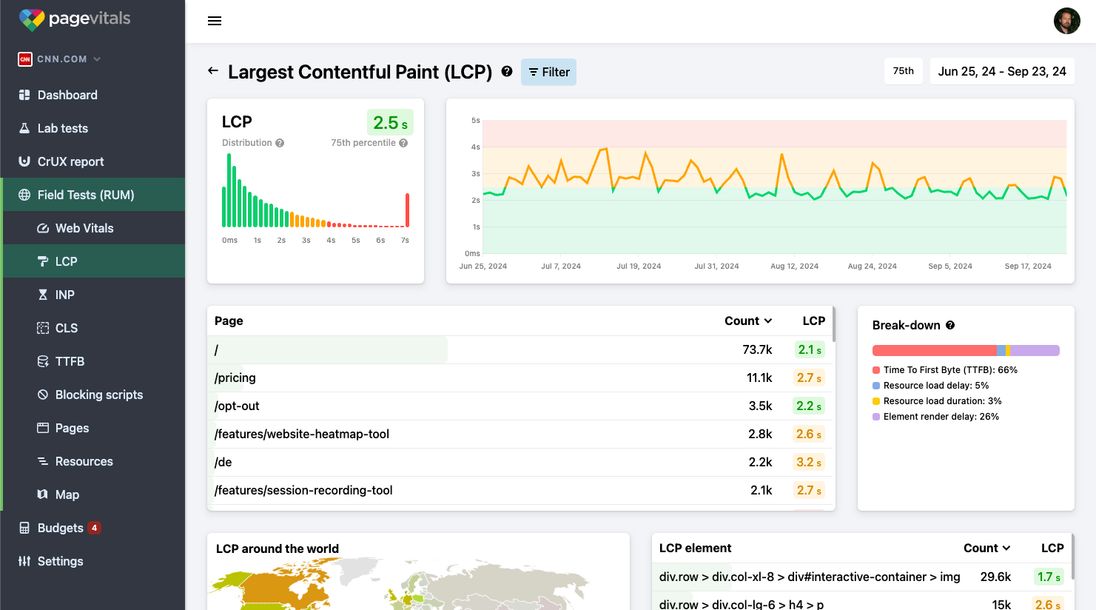
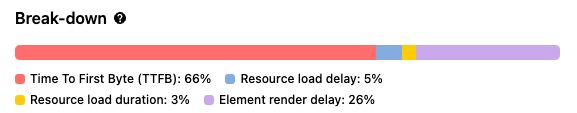
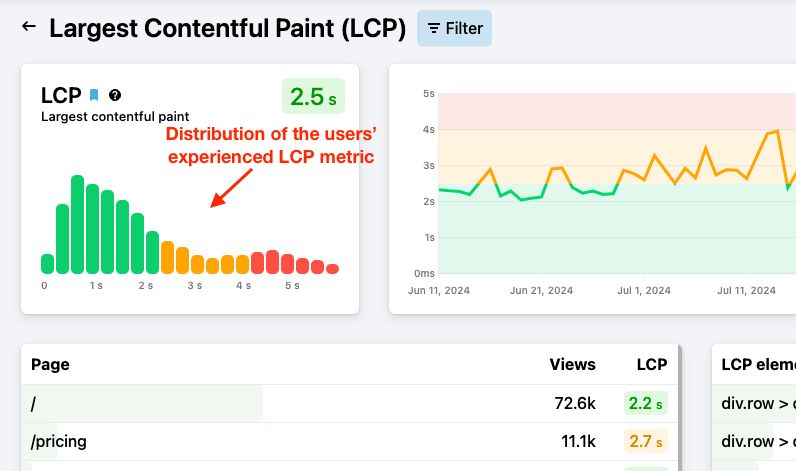
- Largest Contentful Paint (LCP): Get insights into what contributes to your LCP score. Is it the server that's slow at delivering the initial document, is it postponing loading the hero image? Is the hero image too large, or is something delaying the display of that image. All of that can be seen in the LCP breakdown.
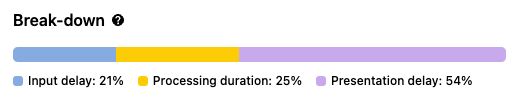
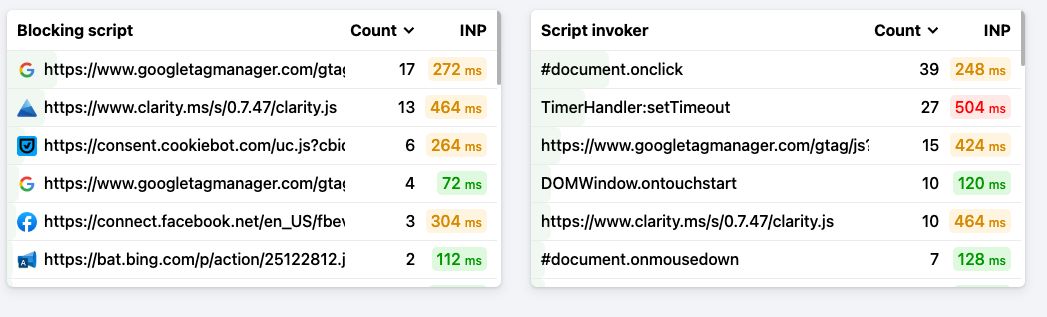
- Interaction to Next Paint (INP): See which user interactions take the longest to process, and track the underlying causes like script execution or render delays. In the break-down you can further analyze if the largest INP is caused by a background script delaying the event handler, if the event handler itself is slow, or if it's the rendering of the visual change that's slow.
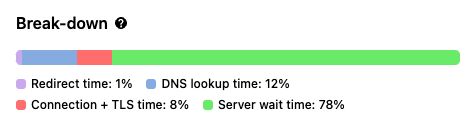
- Time to First Byte (TTFB): Drill down to discover which factors are causing the delay of the first byte of data. The breakdown shows you if it's excessive redirects, DNS lookups, connecting to the server, or just the backend that needs to render uncached pages.
See the updated docs article on Largest Contentful Paint.
🔍 More Filters, Better Insights, Click-to-filter
Our latest update introduces advanced filters so you can get to the root cause of performance issues faster. You can now slice and dice your data by:
- Query string parameters: See if a specific parameter is responsible for a spike in TTFB. In many cases, a UTM querystring or similar can cause the caching system to be bypassed, resulting in slow database lookups.
- Navigation types: Find out if user navigation behavior (click, back/forward, prerender, etc.) affects key metrics like LCP or TTFB. Back/forward which are often (and should often be) ultrafast, may skew your reporting so it's a good idea to try filtering by navigation type.
- Scripts and functions: Track which scripts are impacting INP and see which function invoked the offending code. Are we talking about slow 3rd party scripts running in the background, or slow tracking scripts responding to user input.
- LCP/CLS/INP elements: Filter by which element is considered the LCP element, the largest layout-shifting element, or the clicked element that triggered INP. Discover if different elements are giving different values - maybe a cookie banner on the mobile version is often the LCP.
- Click-to-filter: We've made it easier to filter by most-used filters. Click the row in the table to filter - and click to remove the filter again. Discovering which filters make a big change is faster than ever.
📊 Visualize Performance with Distribution Charts
The updated RUM section also includes distribution charts, so you can see how many users experience different loading times for LCP, INP, and TTFB. These charts give you a clear picture of your site's performance under real-world conditions.
For example, you can track how many users are experiencing a slow Time to First Byte or if the majority of your visitors are seeing good LCP times. You can also see if there's a hidden segment that sees slow loading times although the majority of the visitors experience a fast website. Maybe they see an uncached version, or maybe they see a lot of banners or popups.
🛠 Debug INP with Script and Function Tracing
INP (Interaction to Next Paint) is a critical metric that shows how responsive your site is to user inputs. But tracking down what's causing a poor INP can be tricky. Now, with our new script tracing feature, you can:
- Identify which scripts are causing high INP values.
- See which functions invoked these scripts, so you can pinpoint the root cause and optimize your code.
Putting It All Together
These updates give you a powerful set of tools to understand and optimize your website's real-world performance. With more granular filtering options, click-to-filter tables, and detailed INP tracing, debugging has never been this easy.
Head over to your dashboard to check out the new features and see how they can help you improve your web performance.