Table of contents
Core web vitals explained
A "pretty fast" site can still lose revenue if it feels slow when customers try to scroll, tap filters, add to cart, or complete checkout. Core Web Vitals matter because they quantify those feel-bad moments in a way you can track, benchmark, and prioritize – often revealing issues that don't show up in basic load-time metrics.
Core Web Vitals (CWV) are Google's three user-experience metrics that measure: loading (LCP), interactivity (INP), and visual stability (CLS). They are primarily evaluated using real-user (field) data, not just lab tests.
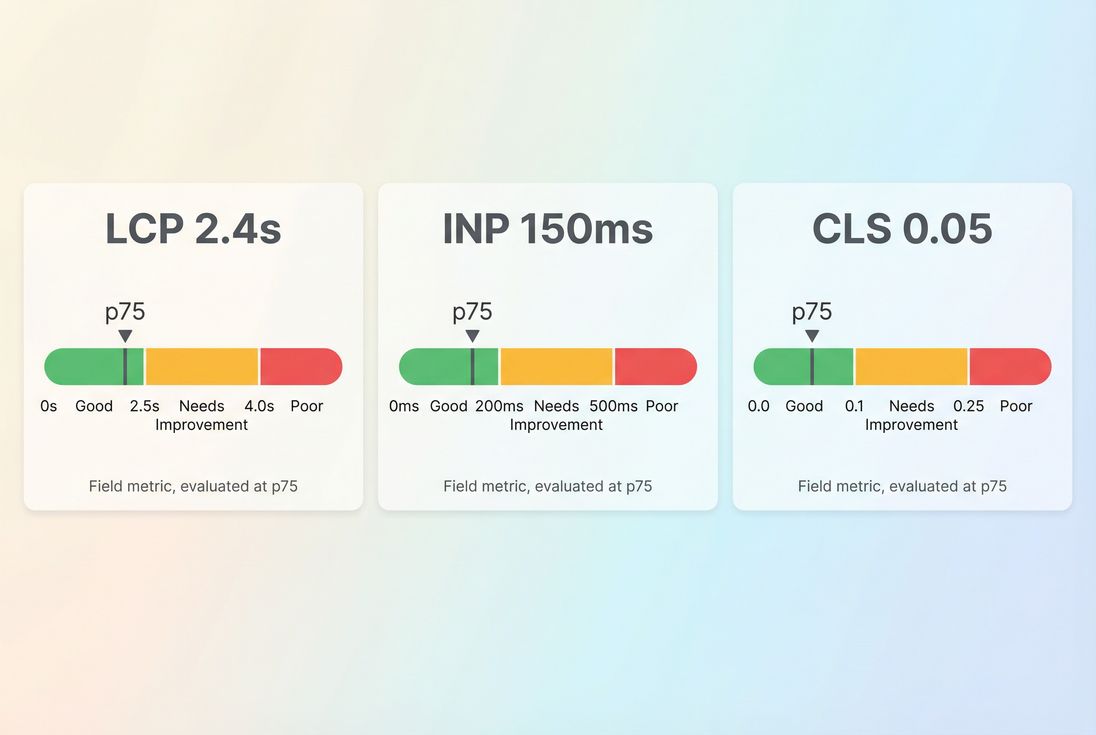
A practical way to read Core Web Vitals: focus on where your 75th percentile user experience lands relative to the good and poor thresholds.
What Core Web Vitals reveal
Core Web Vitals answer a business question website owners constantly face:
- Do most real visitors experience the site as fast and stable?
- If not, where is the friction – loading, responsiveness, or layout?
Each metric maps to a specific type of user pain:
- LCP (Largest Contentful Paint): whether the page looks loaded quickly.
- INP (Interaction to Next Paint): whether the site responds quickly when people try to use it.
- CLS (Cumulative Layout Shift): whether the page stays stable or jumps around, causing misclicks and frustration.
These are part of a broader measurement ecosystem (Lighthouse, PageSpeed Insights, etc.), but CWV have become a shared language between marketing, product, and engineering because they correlate strongly with perceived quality.
The Website Owner's perspective: I don't need "perfect performance." I need to know whether real customers are hitting friction points that reduce conversion rate, increase support tickets, and make paid acquisition less efficient.
What good looks like
Google defines "good" thresholds for each metric and commonly evaluates them using the 75th percentile of real-user visits (often via CrUX data). That means you're optimizing for the experience of your "typical slower user," not your best-case run.
Here are the commonly used benchmarks:
| Metric | What it represents | Good | Needs improvement | Poor |
|---|---|---|---|---|
| LCP | When the main content appears | ≤ 2.5s | 2.5s–4.0s | > 4.0s |
| INP | Responsiveness to interactions | ≤ 200ms | 200ms–500ms | > 500ms |
| CLS | Unexpected layout movement | ≤ 0.1 | 0.1–0.25 | > 0.25 |
Two practical implications for decision-making:
- Passing CWV is about consistency, not a single run. If your homepage is fast but product pages are slow, you can still lose.
- Averages can lie. Averages often look fine while the 75th percentile fails due to slower devices, third-party scripts, or long JavaScript tasks.
For a deeper measurement mindset, it helps to understand field vs lab data and how Web Vitals are collected in practice (Measuring Web Vitals).
How Core Web Vitals are calculated
Core Web Vitals are not "one number for your whole site" by default. They're measured per page (or per URL group) and then aggregated depending on where you're viewing them (Search Console, CrUX, RUM tools, etc.).
The 75th percentile framing
In most reporting contexts, the key value is the 75th percentile (p75) of real visits over a window of time. In plain English:
- 75% of visits are faster/better than this value
- 25% of visits are slower/worse than this value
This is why CWV are so useful operationally: p75 is sensitive to "only happens on older iPhones," "only on slow 4G," and "only when our tag manager injects extra scripts."
Each metric's "shape"
LCP tends to be influenced by the slowest components of your critical rendering path: server response, render-blocking resources, large images, fonts, and late rendering (critical rendering path, render-blocking resources).
INP is primarily influenced by JavaScript and main-thread contention: long tasks, heavy frameworks, expensive handlers, and third-party scripts (long tasks, reduce main thread work, third-party scripts).
CLS is driven by layout instability: images without dimensions, injected content, fonts swapping, and late-loading UI elements (layout instability, zero layout shift).
The Website Owner's perspective: CWV let me separate "we're slow because the server is slow" from "we're slow because marketing added five scripts" from "we're slow because the UI shifts and customers misclick."
Why your scores change over time
Most CWV swings come from one of these patterns:
1) Release-driven regressions
A new feature ships and:
- adds a bigger hero image (LCP worsens)
- adds more JavaScript (INP worsens)
- injects UI above existing content (CLS worsens)
This is why performance budgets matter (performance budgets).
2) Tag and vendor creep
This is the most common "mystery regression" for non-technical teams:
- new analytics tools
- A/B testing libraries
- chat widgets
- personalization scripts
- ad tech
Even when these don't affect total page load time, they often hurt INP by consuming main-thread time at the wrong moments.
3) Infrastructure and caching changes
Server-side and network changes tend to show up first in LCP:
- higher backend latency (server response time)
- CDN misconfigurations (CDN performance, CDN vs origin latency)
- cache TTL changes (effective cache TTL)
- missing compression (Brotli compression, Gzip compression)
4) Seasonality and traffic mix
CWV are field metrics. If your traffic shifts toward:
- more mobile users
- more international users
- more low-end devices (common in paid social)
- slower networks
…your p75 can move even if your code hasn't changed.
How to interpret CWV changes
When you see a CWV change, the goal isn't "make the number green." The goal is make the number explainable and tied to actions.
Use this simple interpretation grid:
| You observe | What it usually means | What to do next |
|---|---|---|
| LCP worsens but INP/CLS stable | Content is heavier or delivery is slower | Check TTFB, hero image, critical CSS, render-blocking |
| INP worsens after a release | More JS or slower handlers | Audit JS execution time, unused JavaScript, long tasks |
| CLS worsens on specific templates | Layout not reserving space | Add dimensions, reserve slots, fix banners/ads, review font loading |
| Lab looks good, field looks bad | Real-user variability and third parties | Segment by device/network; validate with RUM; examine outliers |
The Website Owner's perspective: A CWV regression is a prioritization signal. It tells me whether we should pause campaigns, roll back a release, or accept the hit because the feature is worth it.
How to improve each vital
Don't start with a giant performance project. Start by targeting the page templates that drive revenue: landing pages, category pages, product pages, cart, checkout.
Improve LCP (loading experience)
LCP is the time until the largest above-the-fold element renders (often a hero image, product image, or headline block). Improvements usually come from fixing one of these buckets:
- Faster server and delivery
- Reduce TTFB via caching, optimized backend work, and origin performance
- Use edge caching and correct Cache-Control headers
- Ensure compression is enabled (Brotli compression)
- Make above-the-fold lighter and earlier
- Optimize images (image optimization, image compression, WebP vs AVIF)
- Use responsive images so mobile devices don't download desktop-sized assets
- Prioritize above-the-fold content (above-the-fold optimization)
- Reduce render-blocking work
- Inline or streamline critical CSS
- Remove or defer non-critical scripts (async vs defer)
- Reduce unused CSS and eliminate heavy frameworks where possible
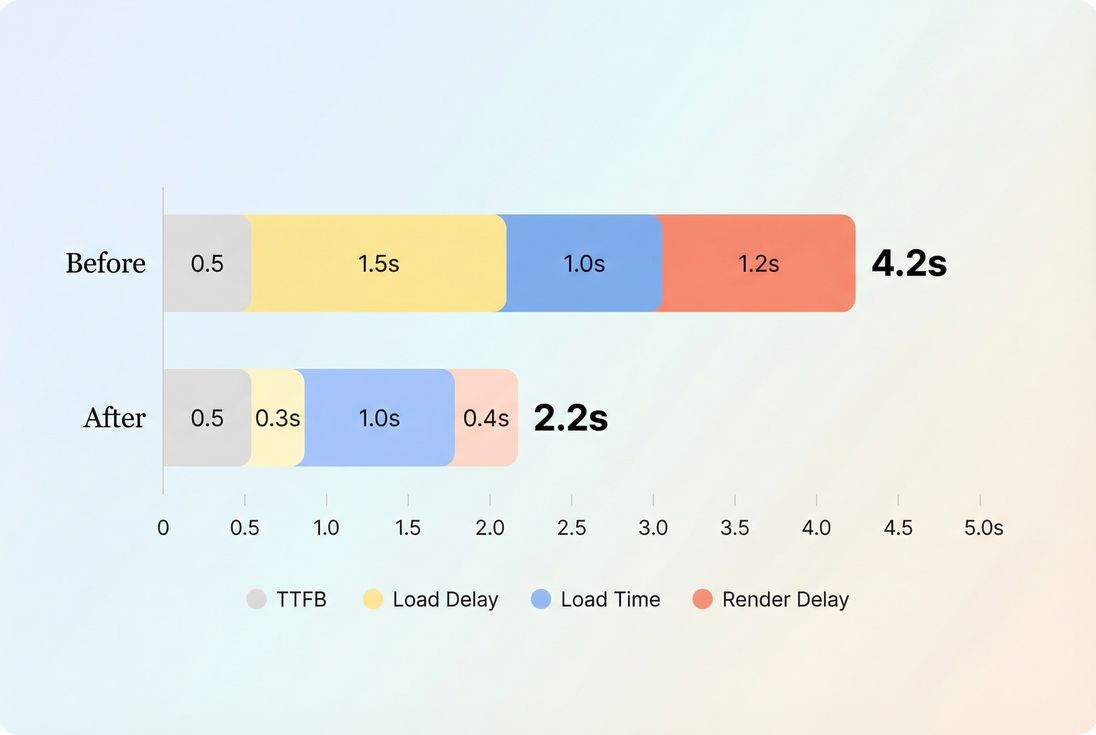
LCP usually improves when you shrink delays before the hero can download and render – often more than the download time itself.
Common LCP "gotcha" on ecommerce: a product hero image that is lazy-loaded or fetched late due to client-side rendering. The fix is often to preload the hero and reduce render-blocking work, not just compress images.
If you want a dedicated playbook, see Largest Contentful Paint and supporting topics like HTTP requests and connection reuse.
Improve INP (responsiveness)
INP measures how quickly the page responds visually after a user interaction (tap, click, keypress). INP gets worse when:
- the main thread is busy (long tasks)
- event handlers do too much work
- rendering is expensive after state updates
- third-party scripts compete for CPU
Practical fixes that move INP:
- Reduce long tasks and JS work
- Identify and break up long tasks (long tasks)
- Reduce JS bundle size with code splitting
- Remove unused JavaScript
- Delay non-essential scripts, especially third parties (third-party scripts)
- Make interactions cheaper
- Avoid heavy synchronous work on click handlers (analytics, DOM queries, layout thrashing)
- Batch DOM updates and reduce forced reflows
- Be cautious with "instant" UI updates that trigger large rerenders
- Watch third-party behavior
- Many sites "pass" LCP but fail INP because tags execute during user interactions.
- Evaluate which scripts are worth the latency tax.
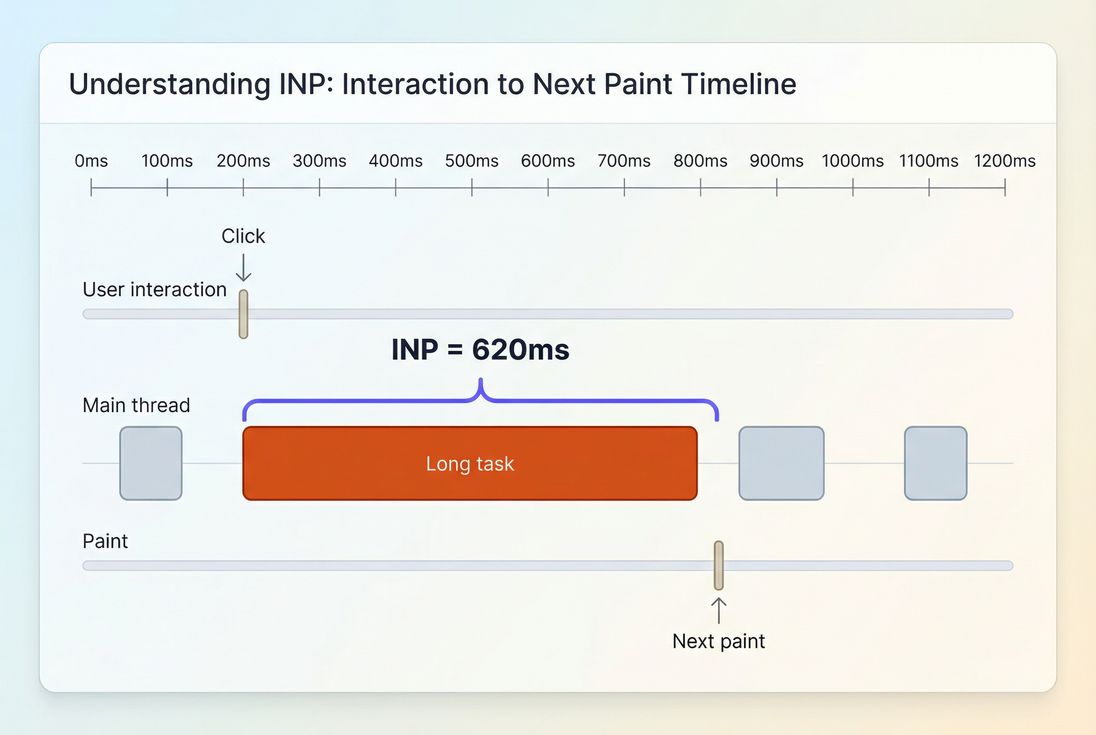
INP spikes when interactions land during long main-thread work – users experience this as taps that feel ignored.
For deeper context, see Interaction to Next Paint and the root causes behind reduce main thread work.
Improve CLS (visual stability)
CLS measures unexpected layout shifts. For website owners, CLS problems show up as:
- misclicks (customer tries to tap "Add to cart" but the button moves)
- reduced trust (page looks broken)
- higher friction in checkout
The highest-leverage CLS fixes are usually straightforward:
- Reserve space for media
- Always set explicit width/height or aspect-ratio for images and videos
- Use stable containers for product image galleries
- Control late injections
- Cookie banners, promo bars, and chat widgets should not push content down after render
- If you must insert content, insert it in reserved space
- Be intentional with fonts
- Poor font loading strategies can cause shifts; review font loading
For an in-depth guide, see Cumulative Layout Shift and layout instability.
The Website Owner's perspective: CLS is the "silent conversion killer" because it creates errors customers blame on themselves. Fixing it reduces customer frustration without changing design or messaging.
How website owners use CWV in real decisions
Here's how CWV should influence what you do next week – not just what you report.
Prioritize by template and funnel step
A common mistake is chasing a "sitewide pass" while ignoring where revenue happens.
A practical priority order for many ecommerce sites:
- Product detail page (PDP): LCP for hero image + INP for variants/add to cart
- Category/listing pages: INP for filters/sorting/infinite scroll
- Cart and checkout: INP stability under heavy JS + minimal CLS
- Landing pages: LCP and CLS to protect paid traffic ROI
Decide what to fix vs accept
Not every regression is a bug. Sometimes it's a tradeoff (new feature, personalization, experiments). CWV help you quantify the cost.
If a new script adds measurable business value but worsens INP:
- try loading it later
- scope it to fewer pages
- replace it with a lighter alternative
- or accept the hit explicitly and monitor the impact on conversion
Set guardrails to prevent backsliding
If you treat performance as a one-time project, CWV will drift back to "needs improvement." Build guardrails:
- Define budgets (performance budgets)
- Review new tags like you review security changes
- Require performance checks in releases and experiments
Measuring CWV without guessing
You generally need both:
- Lab testing to reproduce, debug, and validate fixes quickly
- Field testing to confirm real-user impact and catch third-party and device variability
This is the practical split described in field vs lab data and synthetic vs field testing.
If you're using PageVitals, the most relevant product views for CWV are the Web Vitals field testing reports:
- Overview of Web Vitals field testing: /docs/features/field-testing/web-vitals/
- Metric-specific field reports: LCP report, INP report, CLS report
- CrUX-specific reporting: /docs/features/chrome-ux-report/
And if you want to prevent regressions during releases, connect performance to delivery workflows:
- CI/CD options: /docs/ci-cd/
- GitHub Actions: /docs/ci-cd/github-action/
- CLI: /docs/ci-cd/cli/
- Budgets feature: /docs/features/budgets/
A practical CWV action plan
If you want an efficient, owner-friendly way to act on CWV, use this sequence:
- Pick 3–5 key templates (PDP, category, cart, checkout, top landing page)
- Use field data to find the worst metric per template (usually p75)
- Use lab tests to identify the cause (render-blocking, TTFB, long tasks, layout shifts)
- Ship one focused fix per metric (image priority for LCP, JS reduction for INP, reserved space for CLS)
- Re-check field impact, then set budgets so it doesn't regress
CWV are most valuable when they're treated as an operating metric: a way to keep user experience from quietly degrading as your site evolves.
Frequently asked questions
Aim to have at least 75 percent of real visits meet all three thresholds: LCP at or under 2.5 seconds, INP at or under 200 milliseconds, and CLS at or under 0.1. If you can only prioritize one area first, reduce INP and CLS regressions that affect add to cart and checkout.
Lighthouse is a lab test of one run under controlled conditions. Google evaluates field data from real users, typically using a rolling window and the 75th percentile. Differences in devices, networks, user flows, and A/B tests often explain the gap. Use lab data to debug, field data to validate impact.
Fix the metric that blocks revenue-critical interactions. For most ecommerce sites, INP issues during filtering, variant selection, cart updates, and checkout cause direct friction. Next, address LCP on landing and product pages to improve first impressions and reduce bounce. CLS is usually fastest to fix and prevents misclicks.
Lab improvements are immediate, but field improvements take time because they require enough real traffic and are aggregated over time. Expect days to weeks depending on volume. If only a portion of traffic gets the fix (A/B tests, gradual rollouts), the 75th percentile may lag until most users receive the improved experience.
Treat Web Vitals like uptime: set budgets, monitor key templates, and gate large changes in CI. Regressions commonly come from new third-party scripts, heavier images, and extra JavaScript execution. Track results by page type and device class, and review every new tag for measurable user value.
Want to take PageVitals for a spin?
Page speed monitoring and alerting for your website. Get daily Lighthouse reports for all your pages. No installation needed.
Start my free trial