Analyzing Multistep test reports
Once the Multistep test is set up, it will run automatically at the preset interval, typically daily. If any part of the test encounters an error or an unexpected outcome, an alert will be sent to you notifying of the problem.
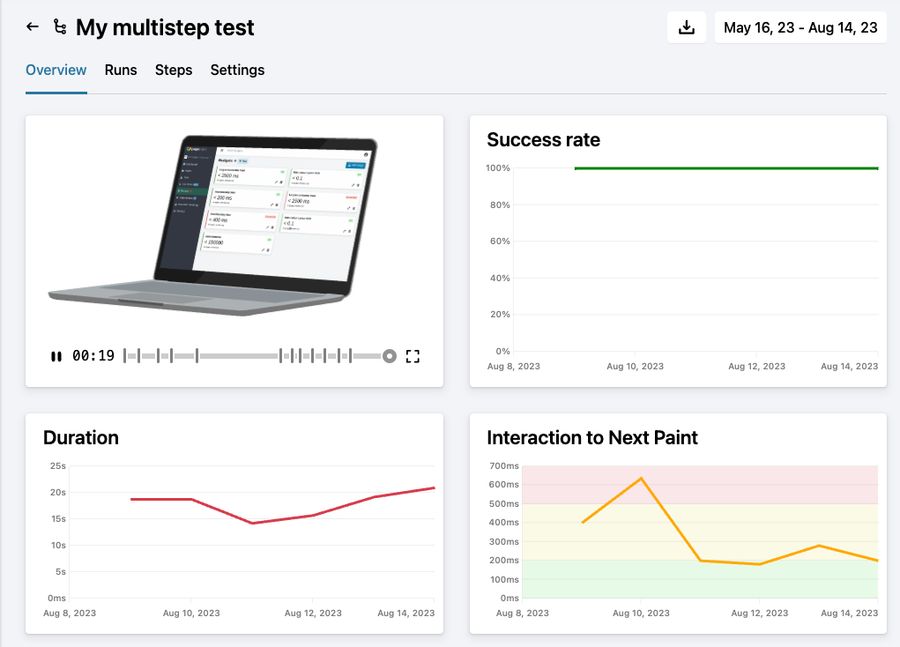
When you click the "Overview" tab of each Multistep test, you'll see the report of that test.

The report contains:
Video: The fastest way to understand how the Multistep test went is to watch the video. If the test didn't succeed, you'll be able to understand what happened. Under the video you'll see a progress bar where each of the steps are shown. Hover over a step marker to see the full step description. If you want to watch the video in full screen, click the full-screen icon under the video.
Charts: There are 7 charts showing different metrics in the selected date range. See a detailed explanation here
CSV Download: You can click the download button next to the date picker to get a CSV file containing the metrics for the selected date range.
Multistep test charts
Success Rate chart: This chart shows the average success rate per day. Use it to track if the multistep test was working or not over time.
Duration chart: This chart shows how long the multistep test took over time. Use it to find out if your website or web application is responding slower over time.
Total Blocking Time chart: This chart shows the summarized number of "long tasks", meaning browser tasks on the main thread that took longer than 50ms, potentially blocking the UI. Note that this metric is measured across the entire multistep test. More on Total Blocking Time.
Interaction to Next Paint chart: This chart shows the largest value of INP during the entire multistep test.
Cumulative Layout Shifts chart: This chart shows the largest value of CLS during the entire multistep test.
Network transfer chart: This chart shows the total number of bytes transferred from the server to the client during the multistep test. Use the chart to see if the weight of your website or web application grows over time.
CPU usage chart: This chart shows how many seconds the browser CPU was busy during the multistep test. Use the chart to see if your website gets more complex scripts over time.
You can follow and chart important metrics including duration (how long the entire test took), interaction delay (how long it took for the application to respond), and layout shifts (unexpected changes in the design during the process). These valuable insights can help you identify glitches, understand areas of improvement, and optimize the website path to ensure a seamless experience.