Table of contents
Time to interactive (TTI)
A page can look loaded and still lose sales because it isn't ready to respond. That's when shoppers tap "Add to cart," open filters, or start typing – and nothing happens (or it happens late). Time to Interactive (TTI) was created to capture that gap between "I see it" and "I can use it."
Time to Interactive (TTI) is a lab metric that estimates how long it takes for a page to become reliably interactive, meaning the main thread is no longer blocked by long JavaScript tasks and the page is in a "quiet" state where user input should be handled promptly.
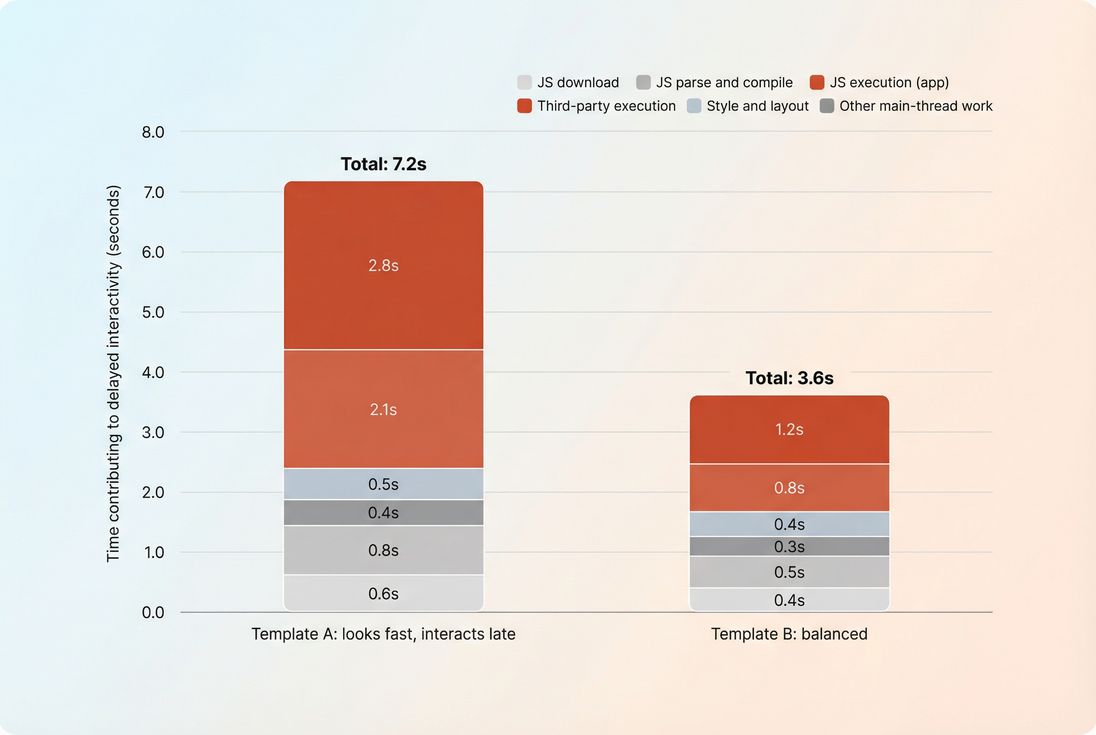
The Website Owner's perspective: TTI helps explain why a redesign "looks fast" in screenshots but still feels sluggish to customers. If your support tickets mention "buttons don't work" or "filters lag," TTI-style problems are often the root cause – even if your visual metrics like LCP are fine.
What TTI reveals
TTI is most useful when you're trying to answer: "Does my page become usable soon after it becomes visible?"
TTI typically rises when the browser is spending too long doing JavaScript work on the main thread – work that competes directly with user input. That's why TTI is often discussed alongside:
- FCP: when something shows up
- LCP: when the main content appears
- Total Blocking Time: how much long-task time blocks interactivity in lab
- INP: real-user responsiveness after interactions (field metric)
A practical way to interpret TTI is as a "JavaScript tax after render." If you reduce that tax, customers can interact sooner.
Common TTI patterns
| What you see in reports | What it usually means | What to do next |
|---|---|---|
| LCP is good, TTI is bad | Page becomes visible quickly, but JavaScript keeps the main thread busy | Investigate long tasks and JavaScript execution time |
| FCP/LCP and TTI are all bad | Both rendering and interactivity are delayed (network + CPU) | Start with TTFB and render-blocking resources |
| TTI improved, but site still "feels laggy" | Load interactivity improved, but runtime interactions still lag | Focus on INP and input handlers |
| TTI is "good" but conversions still dropped | TTI may not reflect actual user workflows (SPAs, post-load scripts, third parties) | Measure key flows with multistep testing and field data |
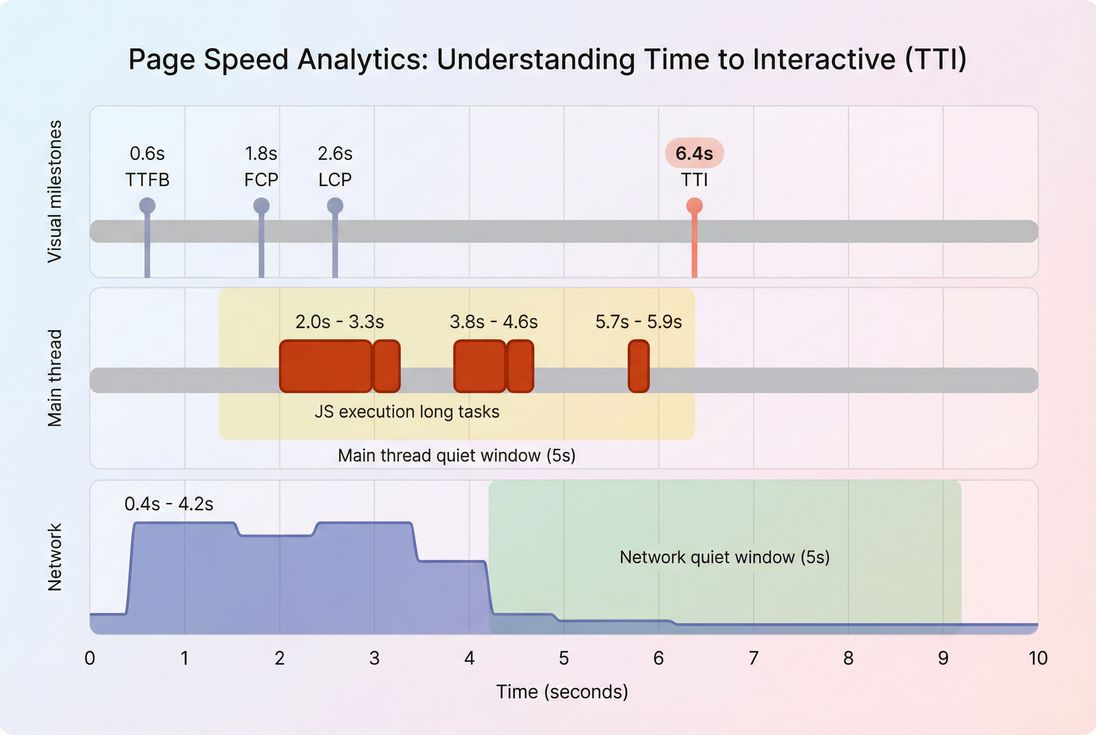
How TTI is determined in lab
TTI is not measured from real users in the Chrome UX Report (CrUX). It's a lab-style metric originally computed by Lighthouse from a single page load on a simulated device/network.
Even though different tools may implement it slightly differently, the core idea is consistent:
- Start after the page begins rendering (after first content is painted).
- Find the last period of "bad busy-ness" on the main thread, usually represented by long tasks (tasks that monopolize the main thread for long enough to delay input).
- Confirm a sustained quiet period:
- The main thread stays quiet (no long tasks) for a continuous window.
- The network is quiet enough (no burst of loading that would soon trigger more scripting work).
- TTI is the first point where those quiet conditions are met.
In other words, TTI tries to estimate when the page stops "thrashing" and becomes predictably responsive.
What counts as "interactive" in practice
For a website owner, "interactive" really means:
- Taps/clicks register promptly (no rage clicks)
- Inputs accept typing without lag
- Menus open without stutter
- Add-to-cart and variant changes respond quickly
TTI does not guarantee your UI is bug-free or that all event handlers are attached correctly. It's a performance proxy: "the browser has enough breathing room to respond."
Why TTI was removed from Lighthouse
Lighthouse 10 removed TTI because, in practice:
- It often duplicated insight you already get from Total Blocking Time in lab
- It could be noisy and confusing across different load patterns
- Teams were optimizing for a score rather than user experience
TTI still describes a real problem (late interactivity), but most teams should now treat it as a supporting diagnostic, while using:
- TBT for lab responsiveness during load (Total Blocking Time)
- INP for field responsiveness (INP)
What drives TTI up or down
TTI is mainly a story about main-thread contention, plus some network factors that indirectly create main-thread work.
The biggest contributors
1) Too much JavaScript to execute
- Large bundles (including unused code)
- Heavy frameworks + hydration
- Expensive initialization logic
- Overly complex client-side rendering
Good next reads: JS bundle size, Unused JavaScript, Code splitting.
2) Long tasks (main thread monopolized) Long tasks are the classic "TTI killer." They prevent input from being processed because the browser can't pause the current work to handle the user.
Good next read: Long tasks and Reduce main thread work.
3) Third-party scripts Tag managers, A/B testing, personalization, chat widgets, review widgets, fraud scripts – often inject scripts that:
- run early
- run often
- run unpredictably
- add more network requests and more JS work
Good next read: Third-party scripts.
4) Render-blocking and post-render work Even after content appears, the browser may still be:
- recalculating styles
- running layout
- parsing additional CSS/JS
Good next reads: Critical rendering path, Render-blocking resources, Critical CSS.
5) Network latency and request overhead Network issues don't just delay downloads; they can stretch out when scripts arrive, which can keep the browser busy later into the load.
Good next reads: Network latency, HTTP requests, CDN performance.
How to measure TTI now
Because TTI is primarily a lab construct, measurement comes down to how you test and how you use the result.
Lab vs field: what you should expect
- Field data (real users): You won't see TTI in CrUX. Use INP for responsiveness and pair it with Core Web Vitals thinking.
- Lab data (synthetic): You can still use Lighthouse-derived metrics like TBT, and in some systems, TTI.
Good reference: Field vs lab data and Measuring Web Vitals.
When TTI is still useful
TTI-style analysis is still valuable when:
- You're launching a new theme/template and want to avoid "looks fast, feels broken"
- You're adding heavy client-side features (filters, configurators, personalization)
- You suspect third parties are delaying interactivity
- You need a simple way to communicate "main-thread overload" to stakeholders
Measuring in PageVitals (where relevant)
If you're using PageVitals' Lighthouse-based synthetic testing, TTI may appear as part of the metrics set depending on the test configuration and Lighthouse version in use. Start with:
- Time to Interactive metric documentation
- Lighthouse tests
- Use the Network request waterfall to correlate late script downloads with late main-thread work
For SPAs and multi-step purchase flows, a single navigation can miss the real pain. Measure TTI-style behavior on key routes and transitions with multistep testing:
The Website Owner's perspective: Don't just test the homepage. If your revenue comes from category filters and PDP variant changes, measure those steps. A "good" initial-load metric won't save you if the page is busy when customers try to use the parts that make you money.
How to improve TTI (without chasing ghosts)
Improving TTI is mostly about making the main thread available sooner. The most reliable approach is to reduce and defer work, then confirm you didn't break user experience.
1) Reduce JavaScript work first
Start by shrinking what you ship and what you execute:
- Remove dead code: Unused JavaScript and Unused CSS
- Split code by route/template: Code splitting
- Keep bundles small and cacheable: Browser caching, Cache-Control headers, Effective cache TTL
- Compress transfers (helps delivery, not execution): Brotli compression or Gzip compression
- Minify to reduce bytes (again: delivery): Asset minification
A key mindset shift: TTI is usually limited by CPU, not bandwidth, especially on mobile. Shipping fewer bytes helps, but shipping less work helps more.
2) Break up long tasks
If you see long tasks dominating, focus on:
- splitting expensive initialization into smaller chunks
- deferring non-essential startup logic
- reducing synchronous work triggered during or immediately after render
This pairs naturally with:
Practical examples that commonly help:
- Delay analytics initialization until after the first user interaction (when acceptable)
- Defer non-critical UI widgets (reviews, recommendations) until after the primary content is usable
- Avoid running large JSON parsing + templating synchronously on load
3) Load third parties with intent
Third parties are frequent TTI regressions because they can change without your deploy.
Actions that tend to move the needle:
- Audit necessity: remove anything not tied to revenue, compliance, or critical measurement
- Delay tags that don't need to block interactions
- Prefer server-side integrations where possible (varies by vendor)
- Use tighter loading control via script attributes: Async vs defer
If marketing needs 12 tags, your job is to make the tradeoff explicit: "This tag costs X seconds of responsiveness on mid-tier mobile."
4) Fix render-blocking and above-the-fold priorities
TTI is not purely a rendering metric, but render inefficiencies can extend the "busy" period.
Focus on:
- Critical CSS and Render-blocking resources
- Above-the-fold optimization
- Fonts (often overlooked): Font loading
5) Don't ignore server and CDN basics
A slow start can "smear" the entire load process and push interactivity later.
Work through:
- Time to First Byte
- Server response time
- CDN vs origin latency and Edge caching
- Connection setup costs: DNS lookup time, TLS handshake, TCP handshake
- Strategic early connections: Preconnect and DNS prefetch
These won't fix a massive hydration problem, but they reduce the chance that scripts arrive late and keep kicking off work later into the page lifecycle.
How website owners should interpret changes
TTI is best interpreted as a directional signal that something changed in "how busy the browser is after content appears."
If TTI improves
Ask:
- Did we actually reduce main-thread work, or did we merely delay it?
- Did Total Blocking Time drop too?
- Did field responsiveness improve (INP)?
If you only delay work, Lighthouse-style metrics can look better while real users still suffer during key interactions.
If TTI worsens after a release
The usual culprits, in order:
- A new third-party tag or tag configuration
- Bundle growth (new features, new dependencies)
- More client-side rendering/hydration
- A "small" script that runs at the worst time (right after paint)
A tight triage loop:
- Compare waterfalls between builds
- Look for new/shifted JS requests
- Check long-task timing clusters
- Confirm on mobile-like CPU conditions (see Mobile page speed)
The Website Owner's perspective: Treat TTI regressions like revenue regressions: isolate the change, identify the owner (app code vs vendor tag), and decide whether the business value is worth the responsiveness cost. If it is, fund the optimization work explicitly – don't hope it "just works out."
Using TTI to make better decisions
Even though TTI is no longer the headline metric it once was, it's still useful as a decision support tool – especially for stakeholder conversations about JavaScript and third parties.
Where it fits in your KPI stack
- Primary field KPI for responsiveness: INP
- Primary lab KPI for load blocking: Total Blocking Time
- Supporting lab diagnostic: TTI-style "when does the browser calm down?"
Turn it into an operational guardrail
If you run synthetic testing in CI, you can prevent "interactive drift" by budgeting the drivers, not the number:
- Max JS bundle size change
- Max long tasks or max TBT
- Limits for third-party requests on key templates
In PageVitals, this is typically implemented via performance budgets and automated testing workflows:
Prioritization: when to work on TTI problems
Prioritize interactivity work when:
- LCP is already decent but customers still report "lag"
- You see high abandonment on pages with heavy filters/configurators
- You're adding (or already have) multiple third-party scripts
- Your mobile conversion rate is disproportionately low vs desktop (often CPU-related)
If your LCP is poor, fix that first – users can't interact with what they can't see. But once visual load is acceptable, TTI-style issues are often the next "hidden" limiter of conversion.
If you want one practical takeaway: use TTI as a flashlight, not a finish line. When it's high, it's pointing at main-thread contention – usually JavaScript execution and third parties. Fix those causes, then validate that real-user responsiveness improved with INP and your business metrics (conversion rate, add-to-cart rate, and checkout completion).
Frequently asked questions
Historically in Lighthouse, a good TTI was under about 3.8 seconds, with 3.9 to 7.3 needing improvement and anything above 7.3 considered poor. Treat these as lab guidance, not a promise for real shoppers. Use TTI to spot JavaScript bottlenecks, then validate impact with INP.
Don't ignore the concept, but don't chase the number. TTI was removed in Lighthouse 10 because it was often redundant and could mislead teams compared to better signals like Total Blocking Time in lab and INP in the field. Use it as a diagnostic hint for main-thread overload, not a KPI.
That pattern usually means the page looks ready, but JavaScript is keeping the main thread busy. Common causes include larger bundles, hydration work, third-party tags, or long tasks triggered right after render. Investigate long tasks and JavaScript execution time, then reduce, delay, or split the code.
Indirectly. TTI is a proxy for how quickly a shopper can reliably interact without clicks feeling ignored. When TTI is high, users try to filter, open menus, or add to cart while the page is still busy, leading to frustration and drop-off. For business reporting, INP is the stronger field metric.
Add lab performance budgets around JavaScript size, long tasks, and Total Blocking Time, and run synthetic tests on key templates before deploying. Watch third-party script changes closely, because they commonly shift TTI. If you can, pair lab budgets with field monitoring of INP to confirm real-user impact.
Want to take PageVitals for a spin?
Page speed monitoring and alerting for your website. Get daily Lighthouse reports for all your pages. No installation needed.
Start my free trial