Table of contents
Page load time optimization
A slow page doesn't just "feel" bad – it quietly taxes every acquisition dollar you spend. Paid clicks bounce, organic rankings stagnate, and repeat customers lose patience. Page load time is one of the fastest ways to spot that tax because it summarizes the whole navigation into a single number you can track.
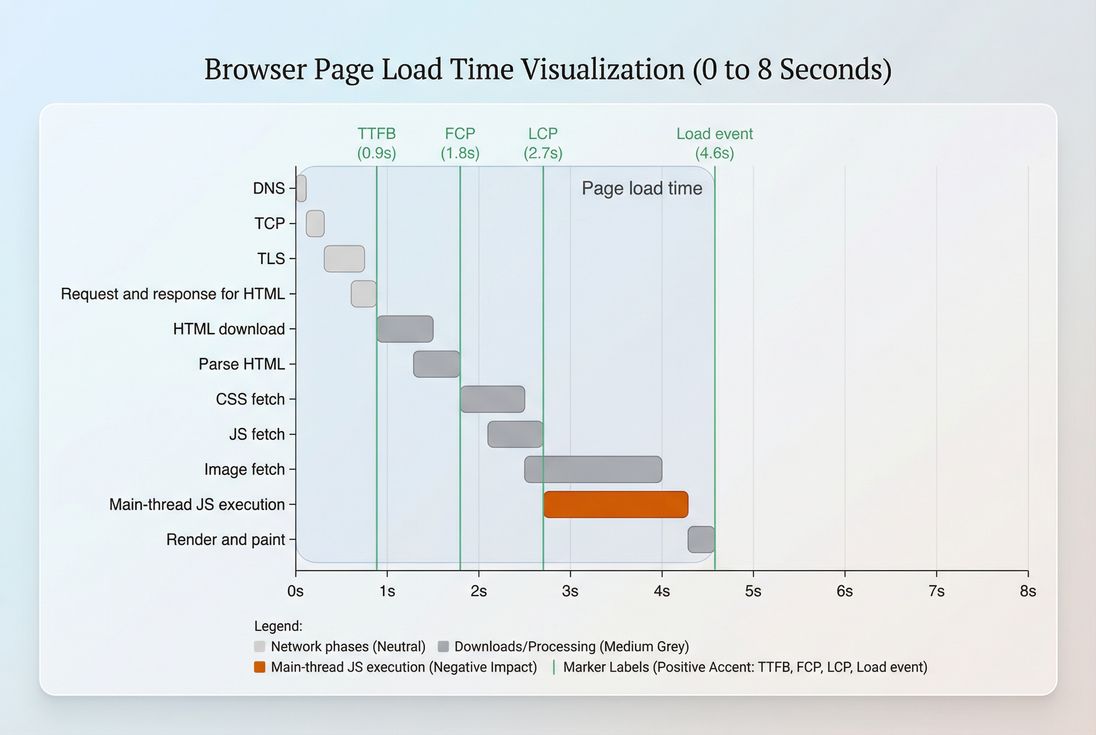
Page load time is the elapsed time from when a navigation starts (a click, URL entry, or redirect) until the browser fires the load event (window.onload). In plain terms: it's when the browser considers the page "loaded," meaning the main document and dependent resources that block the load event have finished.
This metric is useful, but blunt. It often does not equal "the user can see and use the page." That's why you should interpret it alongside Core Web Vitals like LCP (when the main content appears), INP (responsiveness), and CLS (visual stability).
What page load time actually reveals
Page load time is best used as an overall efficiency and risk metric:
- It's sensitive to server slowness, network distance, too many requests, and heavy third parties.
- It's easy to trend over time, so it's good for catching regressions after deploys, tag changes, or infrastructure incidents.
- It's often correlated with business outcomes – but it's not the same as perceived speed.
A common mistake is treating it like a single, definitive KPI. Instead, think of it as a summary of everything that happened before onload, not a guarantee that the page is usable.
If you want the canonical metric definition and how tools report it, see Page load time.
The Website Owner's perspective
Load time is the metric you can show in a weekly ops meeting without explaining browser internals. If it spikes, something changed: hosting, caching, a campaign script, a new app, a new font. It's a "smoke alarm." Then you use deeper metrics (LCP/INP + waterfall) to find the fire.
Load time vs modern user experience
Load time can improve while real UX gets worse. For example:
- You delay non-critical scripts until after the load event: load time drops, but if those scripts block interaction later, INP can worsen.
- You reduce requests but keep a huge hero image: load time improves slightly, but LCP stays slow.
That's why you should always pair this with:
- LCP for perceived loading
- INP for responsiveness
- CLS for stability
- Optionally Speed Index for visual progress
How page load time is calculated
Most tools use the browser's Navigation Timing data:
- Start: navigation start (user initiates navigation or the browser starts loading the URL)
- End:
loadEventEnd(the load event finishes firing)
In practical reporting, you'll see variations like:
- Onload / load event time: what this article focuses on
- Document complete: similar concept in some tools
- Fully loaded: often includes additional activity after onload (late network requests, long tasks, analytics beacons). This can be useful, but it's less standardized.
Two important implications:
- Single-page apps (SPAs): load time is mostly about the initial page load. Subsequent route changes can feel slow even if load time looks fine. For user flows like cart → checkout → confirmation, you'll want multi-step coverage (for example, using multistep test reports to see each step).
- Caching: load time can look dramatically different on a warm cache vs cold cache. That's not noise – it's a signal about how well browser caching and Cache-Control headers are set.
For measurement strategy differences (lab repeatability vs field realism), read Field vs lab data.
What good looks like in practice
There isn't one universal "good" load time because device and network conditions dominate. A 1.8s load time on desktop fiber might correspond to 4–6s on a mid-range phone over 4G.
Still, benchmarks help you prioritize. For mobile on typical 4G, a practical rubric for key landing pages:
| Page load time (load event) | Interpretation | Business impact risk |
|---|---|---|
| < 2.5s | Excellent | Low friction, strong baseline |
| 2.5–3.5s | Good | Usually acceptable, watch LCP/INP |
| 3.5–5.0s | Needs work | Noticeable delay, higher bounce risk |
| > 5.0s | Poor | Conversion and SEO risk rises quickly |
Two rules that prevent bad decisions:
- Segment by device and geography. If you only look at averages, you can "improve" load time for desktop while mobile revenue quietly suffers. Start with Mobile page speed as your default lens.
- Track distribution, not just a single value. Look at medians and worse-percentile performance (often the 75th percentile) so you don't miss real-user pain.
If you're using field datasets like CrUX, review CrUX data and Measuring Web Vitals to understand what's being aggregated.
The Website Owner's perspective
A "small" 300–500ms regression on load time is often the difference between meeting a revenue target and missing it – because it compounds across paid sessions, SEO landings, and returning users. The earlier you catch it (CI, staging, daily monitoring), the cheaper it is to fix.
Why page load time gets slow
Almost every slow load time problem falls into one (or more) of these buckets. The trick is to identify which bucket dominates your pages.
1) Connection and network overhead
Before any real content loads, the browser may do:
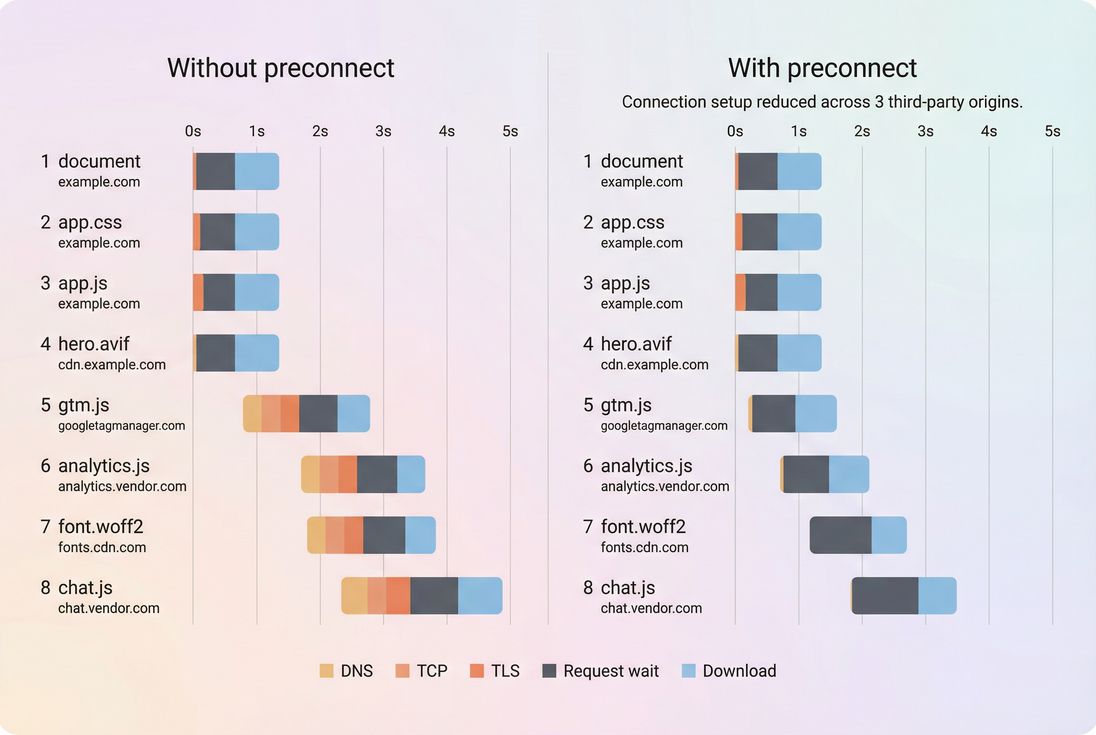
If you depend on many third-party domains, this overhead multiplies. Improvements come from:
- Preconnect for critical third-party origins
- Connection reuse
- Modern protocols like HTTP/2 performance and HTTP/3 performance
- Reducing cross-origin dependencies where possible
2) Slow server response (TTFB)
If your HTML takes too long to start arriving, everything else queues behind it.
Focus on:
3) Too many bytes (especially images)
Total transfer size still matters, particularly on mobile.
Typical high-impact work:
- Image optimization and Image compression
- Choosing modern formats like WebP vs AVIF
- Responsive images
- Enabling Brotli compression (or Gzip compression if Brotli isn't available)
- Asset minification
4) Render-blocking resources
Even if bytes are small, critical CSS/JS can block the first render and delay the load event.
Common fixes:
- Critical CSS
- Removing Render-blocking resources
- Using Async vs defer correctly
- Fixing Font loading so fonts don't block rendering
- Strategic Preload for truly critical assets
5) Too much JavaScript work
JavaScript can delay load via long parse/compile/execution, main-thread blocking, and late layout work.
Key levers:
- Reduce JS bundle size
- Reduce JS execution time
- Code splitting
- Remove Unused JavaScript and Unused CSS
- Minimize Main thread work and Long tasks
6) Third-party scripts
Tag managers, A/B testing, chat widgets, and personalization scripts can dominate both network and CPU.
Start with a simple inventory using your waterfall, then apply governance:
- Only load what you use
- Delay non-critical tags
- Prefer server-side integrations where feasible
- Continuously re-audit after marketing changes
For the foundational model behind these bottlenecks, review the Critical rendering path.
How to optimize page load time (prioritized)
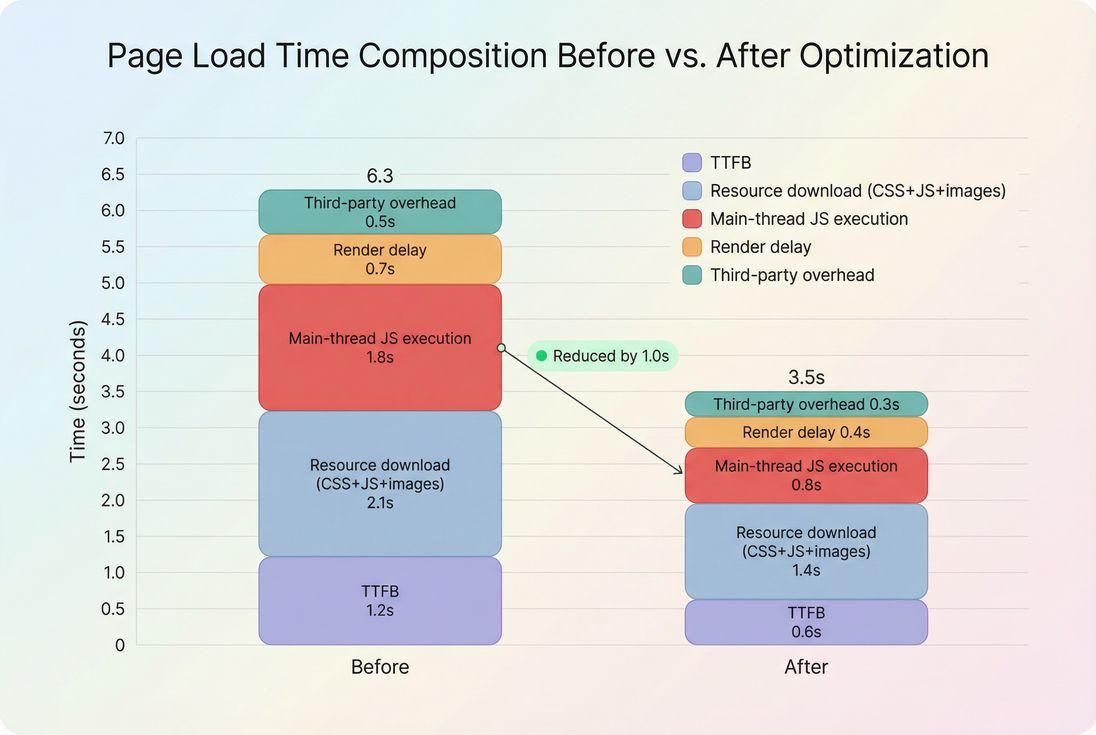
Optimization is easiest when you treat load time like a budget: you can "spend" time on server response, bytes, and CPU, but you can't spend the same second twice.
Step 1: Measure the right pages, the right way
Pick a small set of pages that represent revenue:
- Home
- Category/collection
- Product detail
- Cart
- Checkout entry (and a post-login page if applicable)
Then test consistently:
- Fixed device/network profile (lab)
- Multiple runs, compare medians
- Separate cold vs warm cache if possible
If you need help reading results, Google PageSpeed Insights is a good baseline tool, but don't stop at a single test run.
In PageVitals, two docs links that directly support this workflow:
- Use a request waterfall to see what's slow: Network request waterfall
- Keep results stable by controlling the environment: Test agent settings
Step 2: Fix TTFB before micro-optimizing the front end
If TTFB is high, front-end tuning hits diminishing returns.
High-impact actions:
- Cache HTML where safe (full-page caching for anonymous users)
- Add a CDN and tune cache rules (CDN performance, Edge caching)
- Fix origin bottlenecks (slow database queries, overloaded app servers)
- Avoid expensive personalization on the initial HTML response
Also verify caching correctness:
Step 3: Cut bytes that delay first render
Focus on the biggest payloads first.
Typical wins:
- Convert and resize images (Image optimization, Responsive images)
- Use modern formats (WebP vs AVIF)
- Enable compression (Brotli compression)
- Minify CSS/JS (Asset minification)
Don't forget the "death by a thousand cuts" issue: a large number of small resources creates extra overhead via HTTP requests, especially across many hostnames.
Step 4: Shorten the critical rendering path
This is where you often see LCP and load time improve together.
Practical targets:
- Inline or generate Critical CSS for above-the-fold layout
- Remove or defer Render-blocking resources
- Use Async vs defer so scripts don't block parsing
- Use Preload sparingly for the hero image or critical CSS
- Improve Font loading to avoid delayed text rendering
For above-the-fold prioritization, see Above-the-fold optimization.
Step 5: Reduce JavaScript cost and main-thread blocking
If your waterfall looks "fine" but load time stays high, CPU work is often the culprit.
Action plan:
- Split bundles (Code splitting)
- Delete dead code (Unused JavaScript, Unused CSS)
- Audit heavy libraries and polyfills
- Break up long tasks (Long tasks)
- Reduce Main thread work
This step typically improves both load time and interaction metrics like INP.
Step 6: Put third parties on a leash
Third-party scripts are often the fastest way to lose performance without touching your codebase.
Governance that works:
- Categorize each third party: revenue-critical, ops-critical, nice-to-have
- Load nice-to-have scripts after user intent (scroll, click, or after main content)
- Remove duplicates (two analytics, two heatmaps, multiple tag containers)
- Continuously audit after marketing launches
Deep dive: Third-party scripts
The Website Owner's perspective
Your team will be tempted to treat third parties as "free" features. They aren't. Every tag has a cost in latency, stability, and troubleshooting time. If a vendor can't justify lift (or can't load asynchronously), it shouldn't be on your critical path.
How to interpret changes without fooling yourself
Look for cause-and-effect patterns
When load time changes, ask:
- Did TTFB change? (origin, caching, CDN, incident)
- Did transfer size change? (new images, larger bundles, missing compression)
- Did request count/domains change? (new tags, new fonts, more integrations)
- Did CPU cost change? (new JS, heavier frameworks, personalization)
Then confirm with supporting metrics:
- If load time improves but LCP doesn't, your work likely didn't help the hero element.
- If load time improves but INP worsens, you may have moved work later, not removed it.
Compare like-for-like
To make load time decisions you can trust:
- Compare the same page template (not a random URL mix)
- Use consistent lab settings
- Track trends over time, not single runs
- Segment by mobile/desktop and key geos
For real-user validation, rely on Real user monitoring and datasets like CrUX data.
If you're using PageVitals field capabilities, these docs are relevant:
- CrUX reporting: Chrome UX Report
- Segment field data: Field testing filters
How to prevent regressions (the part most teams skip)
Optimization is wasted if you can't keep the gains.
Set performance budgets
Budgets turn "we should keep it fast" into enforceable rules. Examples:
- Load time must not exceed X on key pages in lab tests
- LCP and INP must stay within thresholds
- JS bundle size must not grow beyond a limit
Docs reference: Performance budgets
Gate changes in CI/CD
Run automated tests on pull requests or deploys so regressions never reach customers.
Docs references:
- GitHub Actions CI/CD
- CLI CI/CD
- CI/CD overview: CI/CD overview
Monitor flows, not just single pages
E-commerce performance often fails in the journey (cart/checkout), not the homepage. Use step-by-step monitoring where possible:
The Website Owner's perspective
The goal isn't a one-time speed "project." It's reducing revenue risk. Budgets + CI + monitoring turns performance into operations: you catch the broken tag, the oversized hero image, or the slow origin change before it becomes a conversion drop you can't explain.
Practical checklist (start here)
If you want a quick, high-ROI path to better page load time:
- Measure key templates consistently (mobile first), and trend results.
- Fix TTFB issues first: caching + CDN + origin performance.
- Reduce image weight aggressively; use responsive images and modern formats.
- Remove render blocking CSS/JS; inline critical CSS where appropriate.
- Cut JavaScript execution time via splitting and removing unused code.
- Audit and restrict third-party scripts; preconnect only for truly critical origins.
- Add budgets and CI checks to stop regressions.
For related deep dives, the most common next reads are:
Frequently asked questions
For mobile shoppers, aim for a load event under about 3 to 4 seconds on key landing pages, with your biggest pages closer to 2 to 3 seconds. Treat this as a directional target, then validate with Core Web Vitals like LCP and INP for real user experience.
Page load time can drop while the user still waits on the largest content, layout shifts, or JavaScript responsiveness. For example, moving work after the load event can reduce load time but hurt INP. Pair load time with LCP, CLS, and INP to confirm the perceived experience actually improved.
Use Core Web Vitals to prioritize user-perceived speed and responsiveness, then use page load time as a guardrail for overall efficiency and operational issues. If load time spikes, you likely have server, network, or third-party regressions. If CWV is poor, focus on rendering and JavaScript work.
Load time varies with device CPU, network latency, caching state, geographic distance to the origin, and third-party behavior. Lab tools can also define the end differently, such as load event versus fully loaded. Standardize test settings and compare medians over multiple runs, then confirm trends with field data.
The largest wins typically come from improving TTFB, reducing total bytes (especially images), cutting render-blocking CSS and heavy JavaScript, and controlling third-party scripts. Start with the biggest contributors in your waterfall, then re-test. Small optimizations add up, but one bottleneck often dominates.
Want to take PageVitals for a spin?
Page speed monitoring and alerting for your website. Get daily Lighthouse reports for all your pages. No installation needed.
Start my free trial